Are You Tired of Technical Indicators that Produce More Lines on Your Charts than Profits?
Discover How to Trade with Moving Averages Even if You’re Losing Money Using it.
Wait. Moving Average might have made you some money, yeah, sure!
In the last stages of a bull market, you can buy just about anything and make money with Moving Averages.
My point is, that it’s not going to do it forever, especially as the market starts chopping. Let’s take a look at this example:
I use Simple Moving Averages 9 and 21 to illustrate the point. I picked the variables 9 & 21, but you can use 14, 50, 250, and more or less, you will eventually encounter this same situation.
Here’s how Moving Average works- go long on a market when the fast moving-average-line (MAL) crosses up the slow MAL. And short the market when the fast MAL crosses down the slow MAL. On many occasions, you will experience false signals like the below…
Below is an hourly EURUSD chart on 6th June 2017.
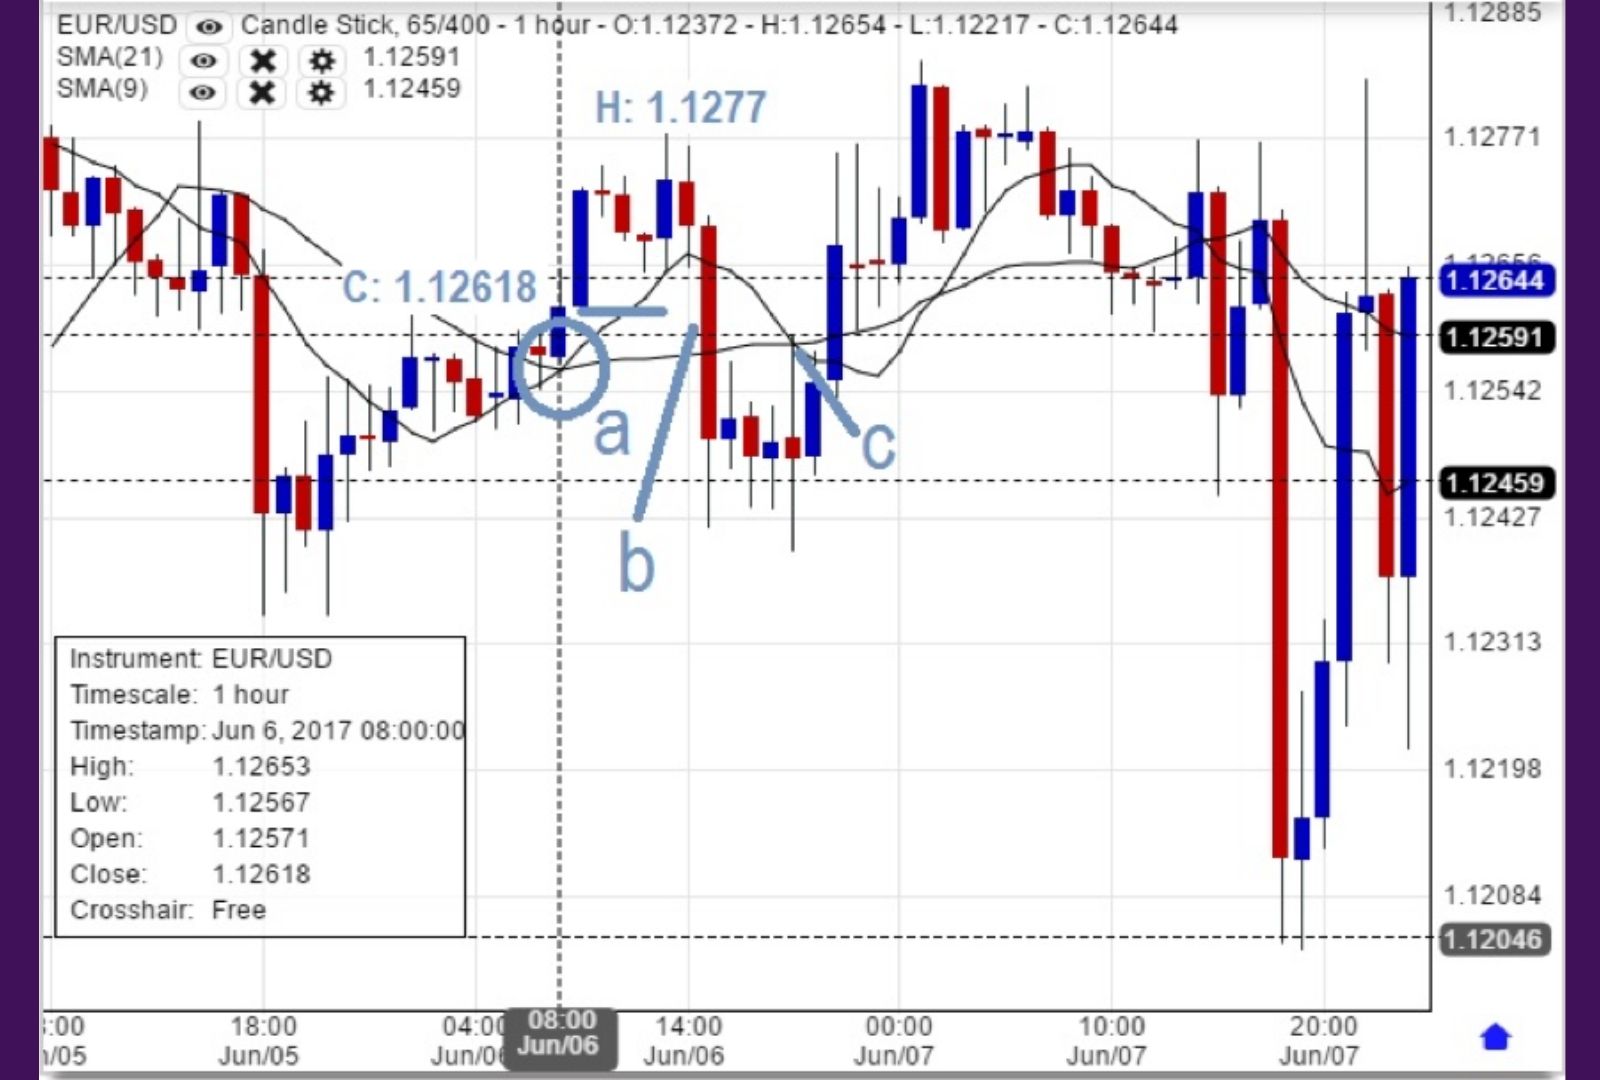
Long EURUSD signal at Point “a”, as the fast Moving Average Line (MAL) crosses up the slow MAL.
Here I used the variables 9 & 21. You can apply 14, 50, 250, more or less, and you would encounter a similar situation.
The crossover wouldn’t occur unless the price had spiked enough to pull up its 9-day average value above its 21-days average. Most likely you won’t get the MAL crossover signal until the price reaches 1.1261, and you went long at that point.
Moving Average doesn’t work when the market starts chopping!
After then, you might expect a 50pips, 100pips, or even 200-pips uptrend movement at a time “a,” but 5 hours later, the Euro’s highest price only touches a disappointing 16-pips uptick (High @1.1277). My guess is, that you wouldn’t settle for such a small profit!
Just 2 hours later, you will quickly find the market did not only retrace but dropped below the 1.1261 entry point (see “candlestick b”).
By that time, probably 70% of all traders would have exited the market then and taken the loss.
However, if you are a firm believer of the Moving Average Crossover Strategy and wait until there is a next MAL crossover signal to buy/ sell, You will end up losing more when you receive the next MAL crossover Sell signal at a time “c,” as the fast MAL crosses down the slow MAL.
And to look forward a few hours more, the market rallies back and heads in the opposite direction after you sold your position at point “c”. You certainly ended up in a bigger loss!
If you have to go through these kinds all false signals (buy at point “a”, sell at point “c”) over and over again, it will probably drive you insane!
So why does the Moving Average Crossover Strategy fail in the EURGBP example above?
First things first, let us understand how Moving Average works.
It is a post-price movement indicator, i.e., a lagging Indicator.
Moving Average gives signals AFTER the market has shown a major price movement. Moving Average trades are profitable ONLY if such a major price movement continues until you close your position.
The KEY success factor of using the Moving Average Crossover Strategy is that you need to foreknow the market is undergoing a Strong Trend.
Moving Average works best during trending periods cos it is a lagging indicator.
Want more clarity? Watch the video below.
FIRST – Analyze the Market Condition – Is it a trending or a range-bound market?
SECOND - Use Moving Average only works when you know the market is undergoing a Strong Trend.
I’ve got some great new trading content that is super helpful to find the trend and, more importantly…be on the right side of the trend!
For a limited time, you can have access to the 4-Week Trade like W.D. Gann Challenge for just $1. It is a Mathematical Formula based on a Legendary Wall Street Trader, W.D. Gann’s Law of Vibration. To help you get the Best Results and NOT have to be glued to the computer, Astro trade alerts will be sent to you via Telegram during the Challenge.
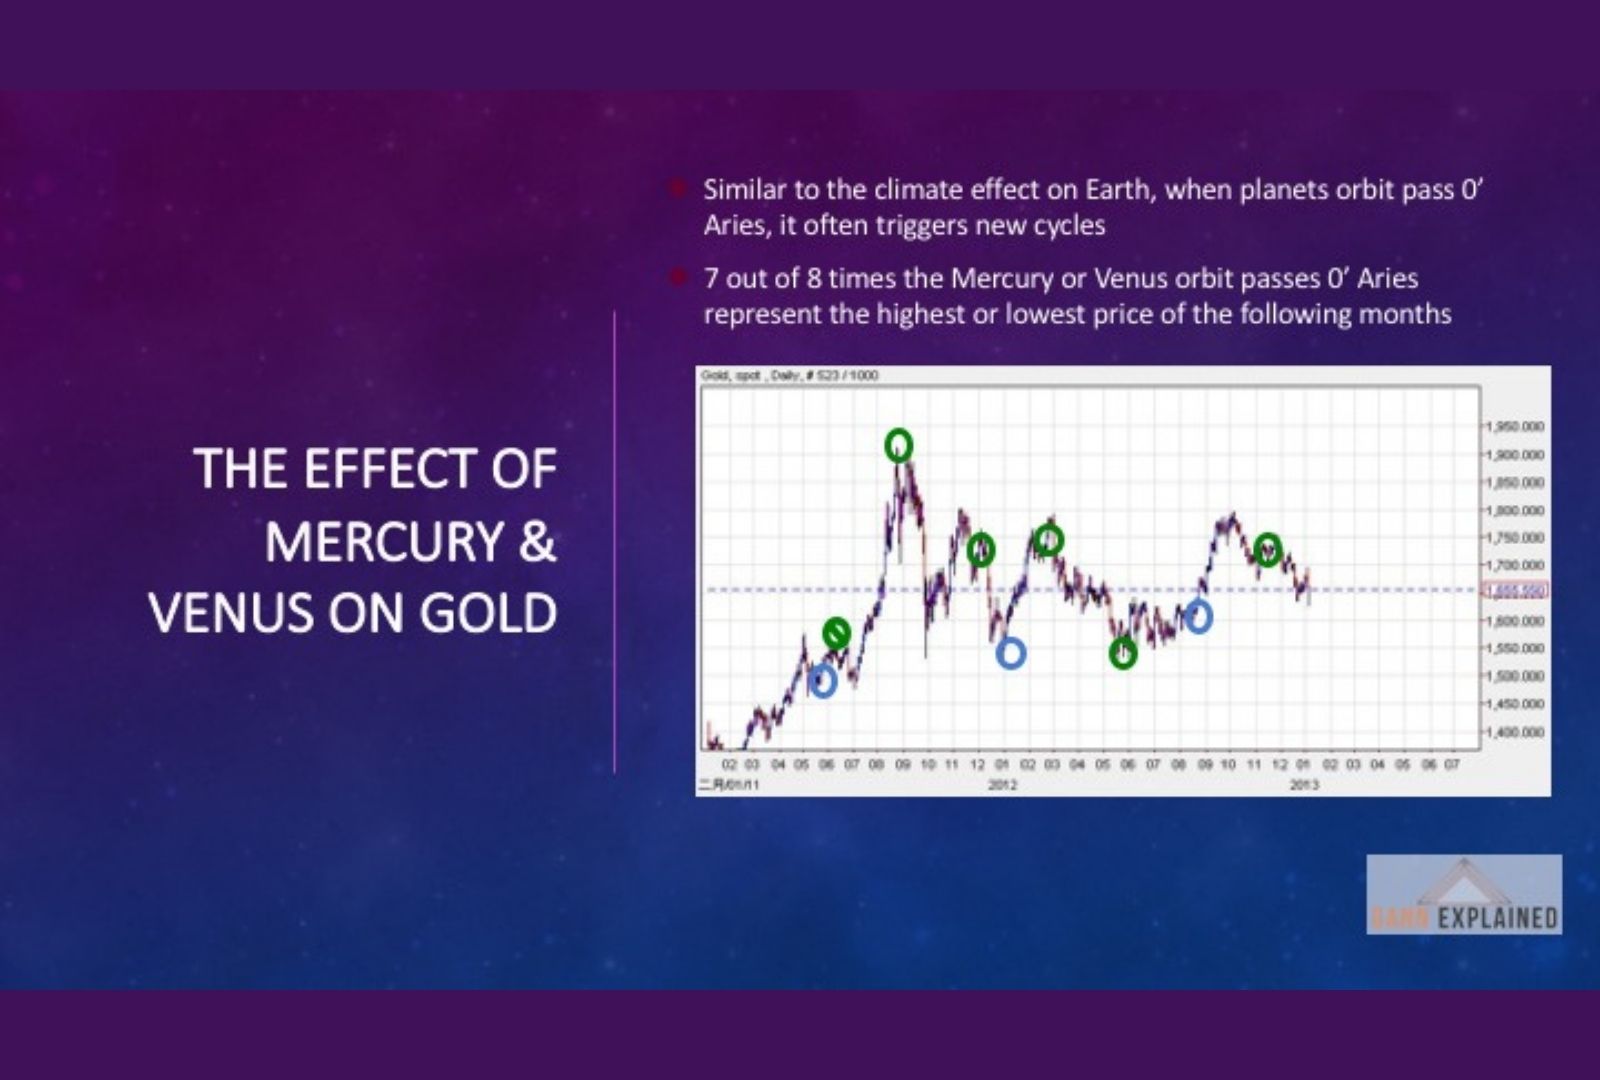
In case you haven't heard of Astro trading, W.D. Gann is known for using geometry, astrology, and ancient mathematics to calculate the price, and time and predict the turn of the financial markets. In this presentation, I’m going to show you 3 Interesting Facts about Financial Astrology:
#1. it is an Earth Science. Astrology has had a strong influence on leaders in history, including the US President & the First Lady, Ronald & Nancy Reagan, and bankers like J.P. Morgan.
You can download the presentation FREE on Scribd: https://www.scribd.com/document/402886300/Introducing-Financial-Astrology-that-helps-you-Calculate-Price-Time-Turn-of-the-Market
#2. A study of correlations between the Moon phases and financial markets was conducted by an Investment Bank.
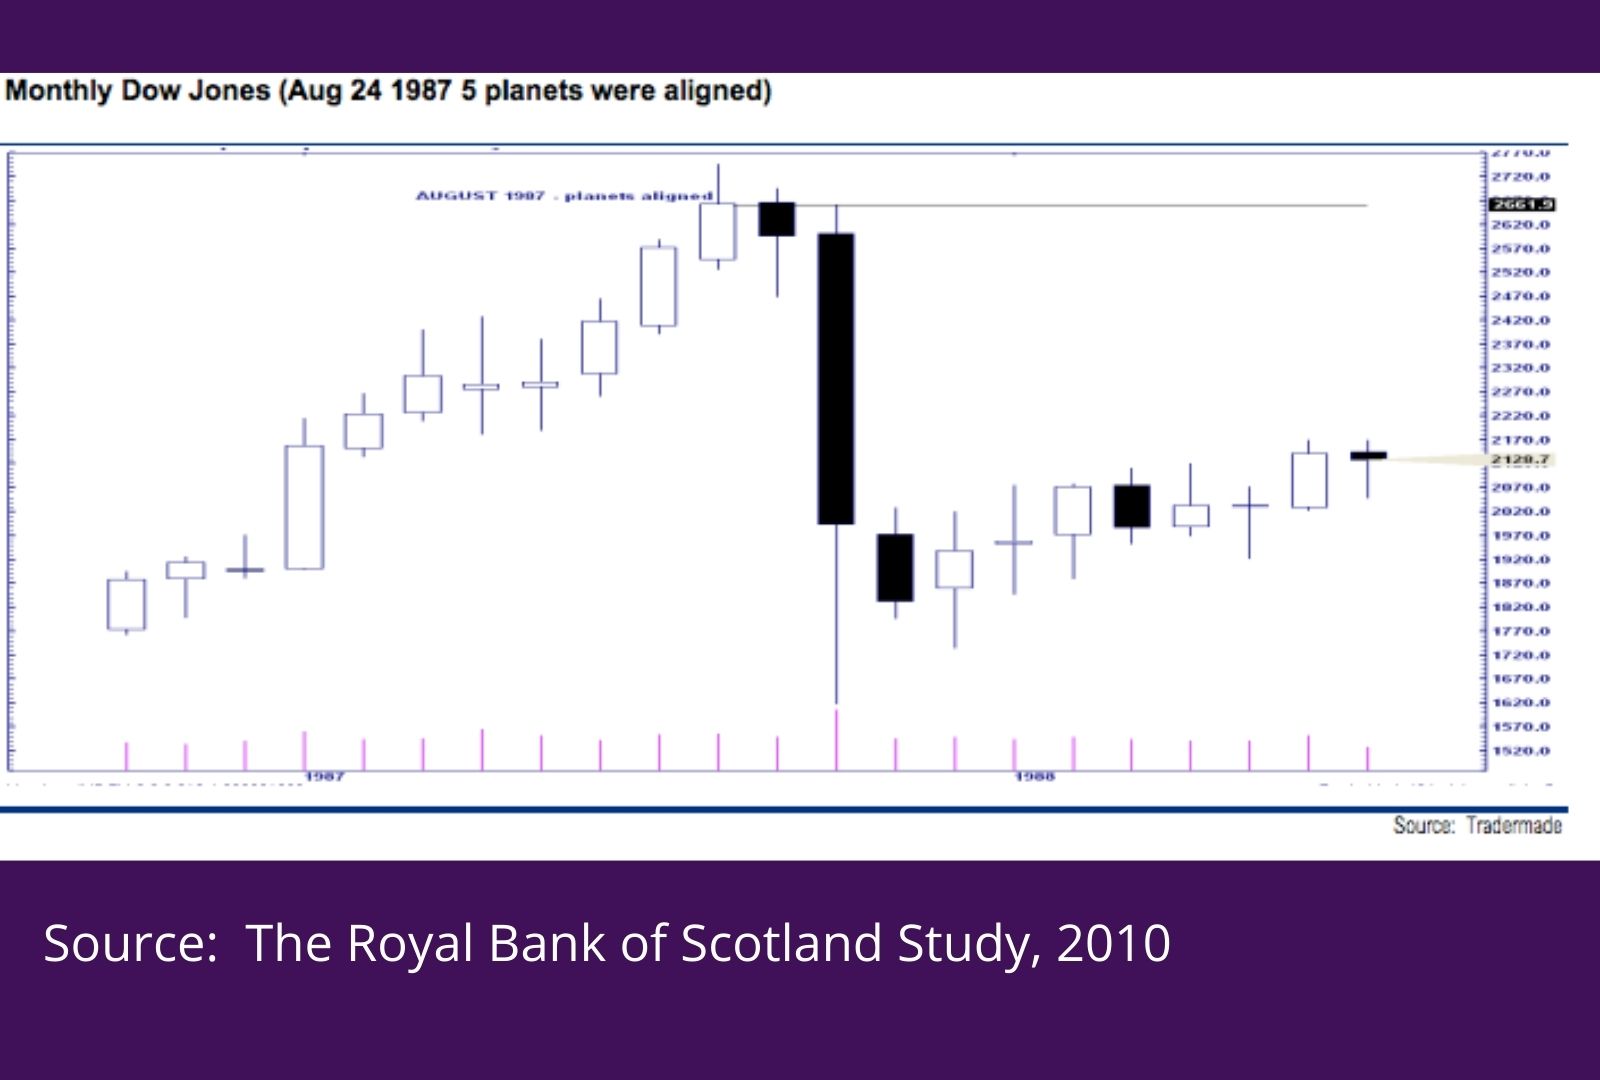
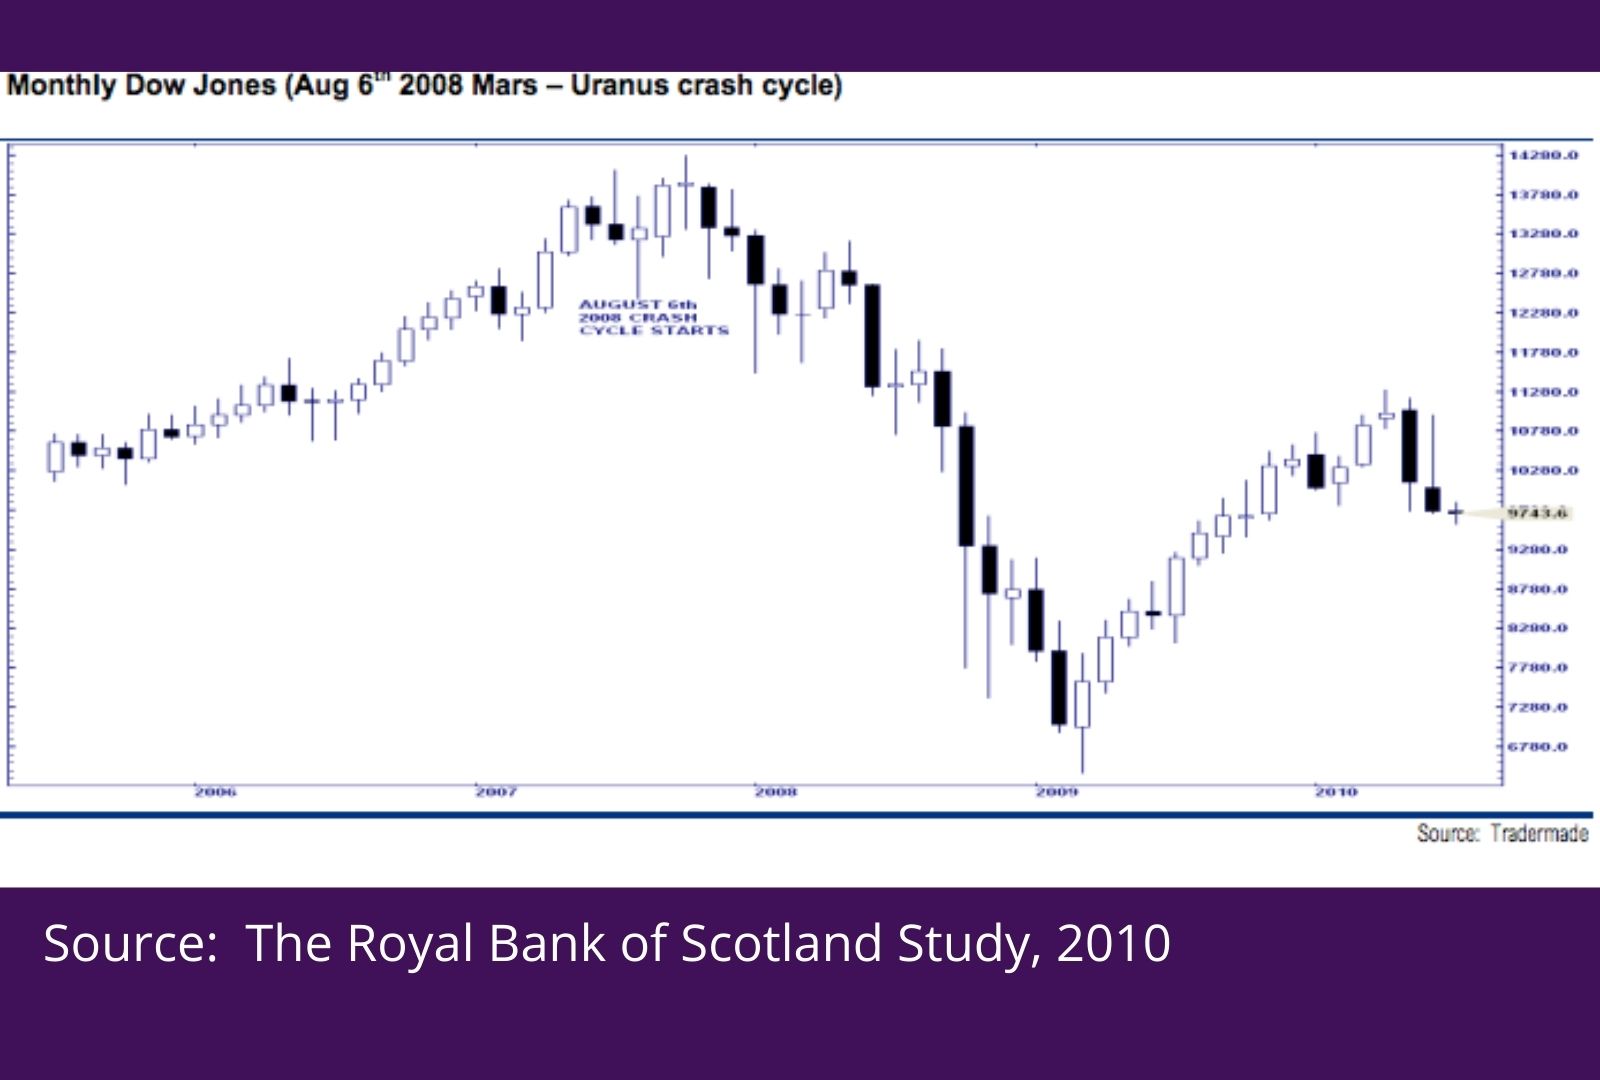
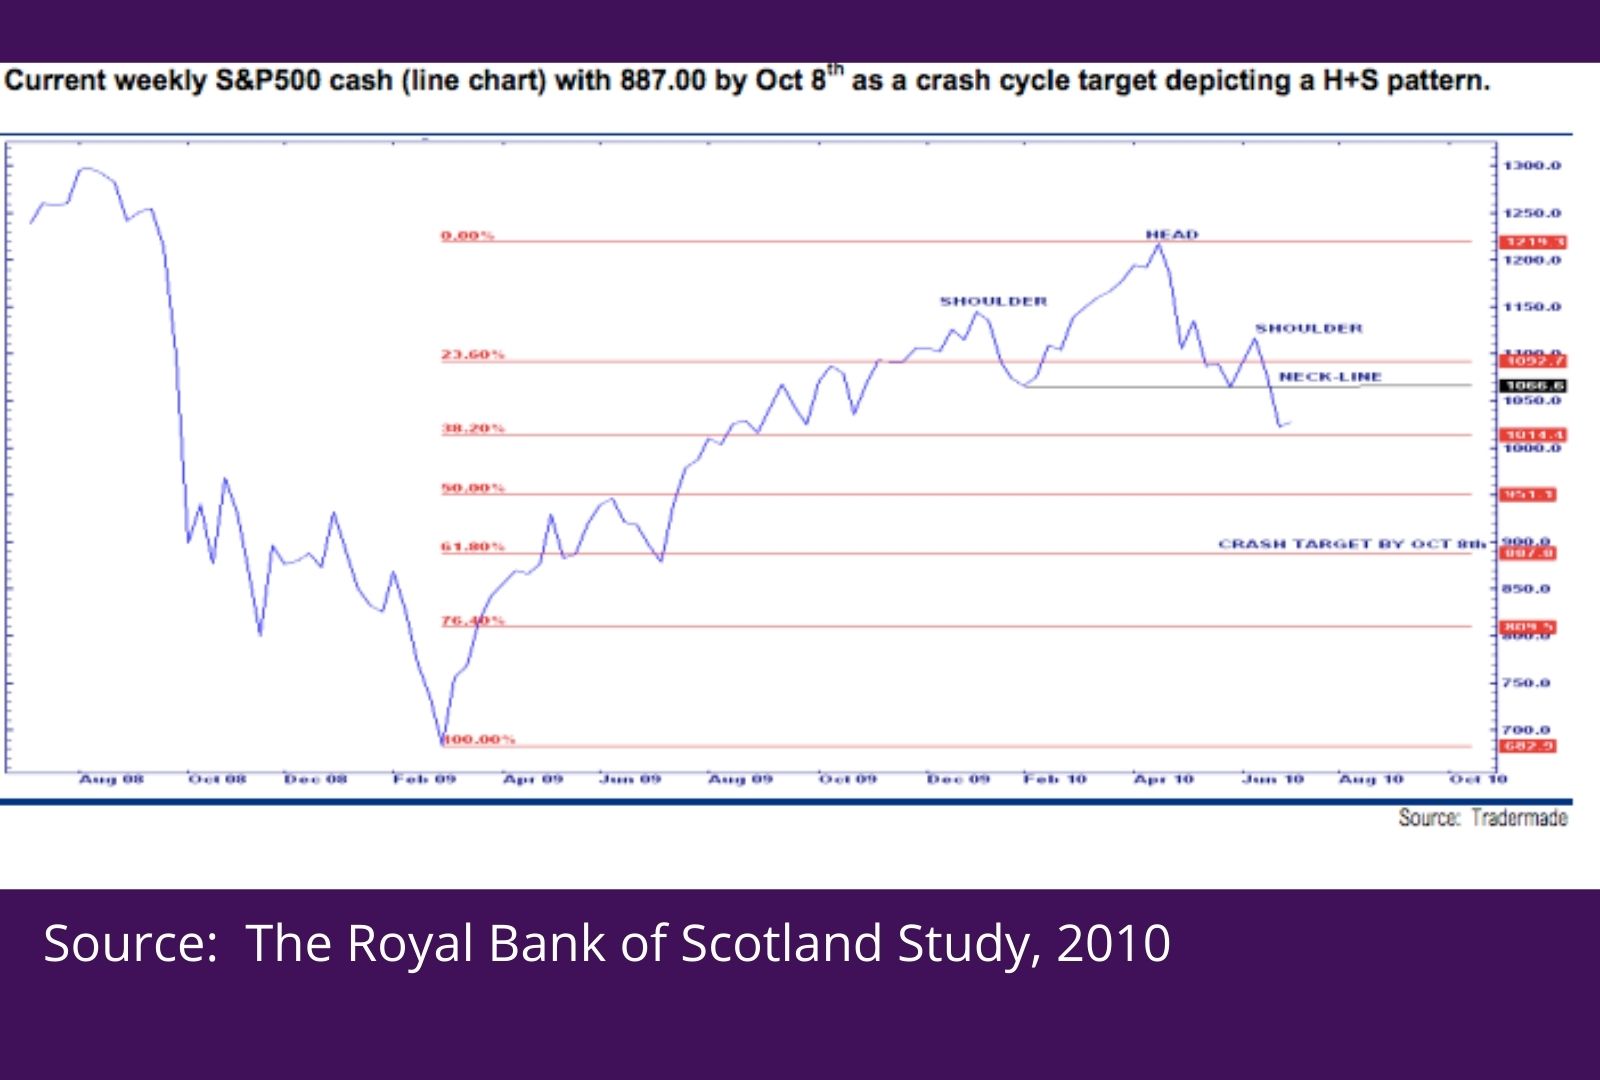
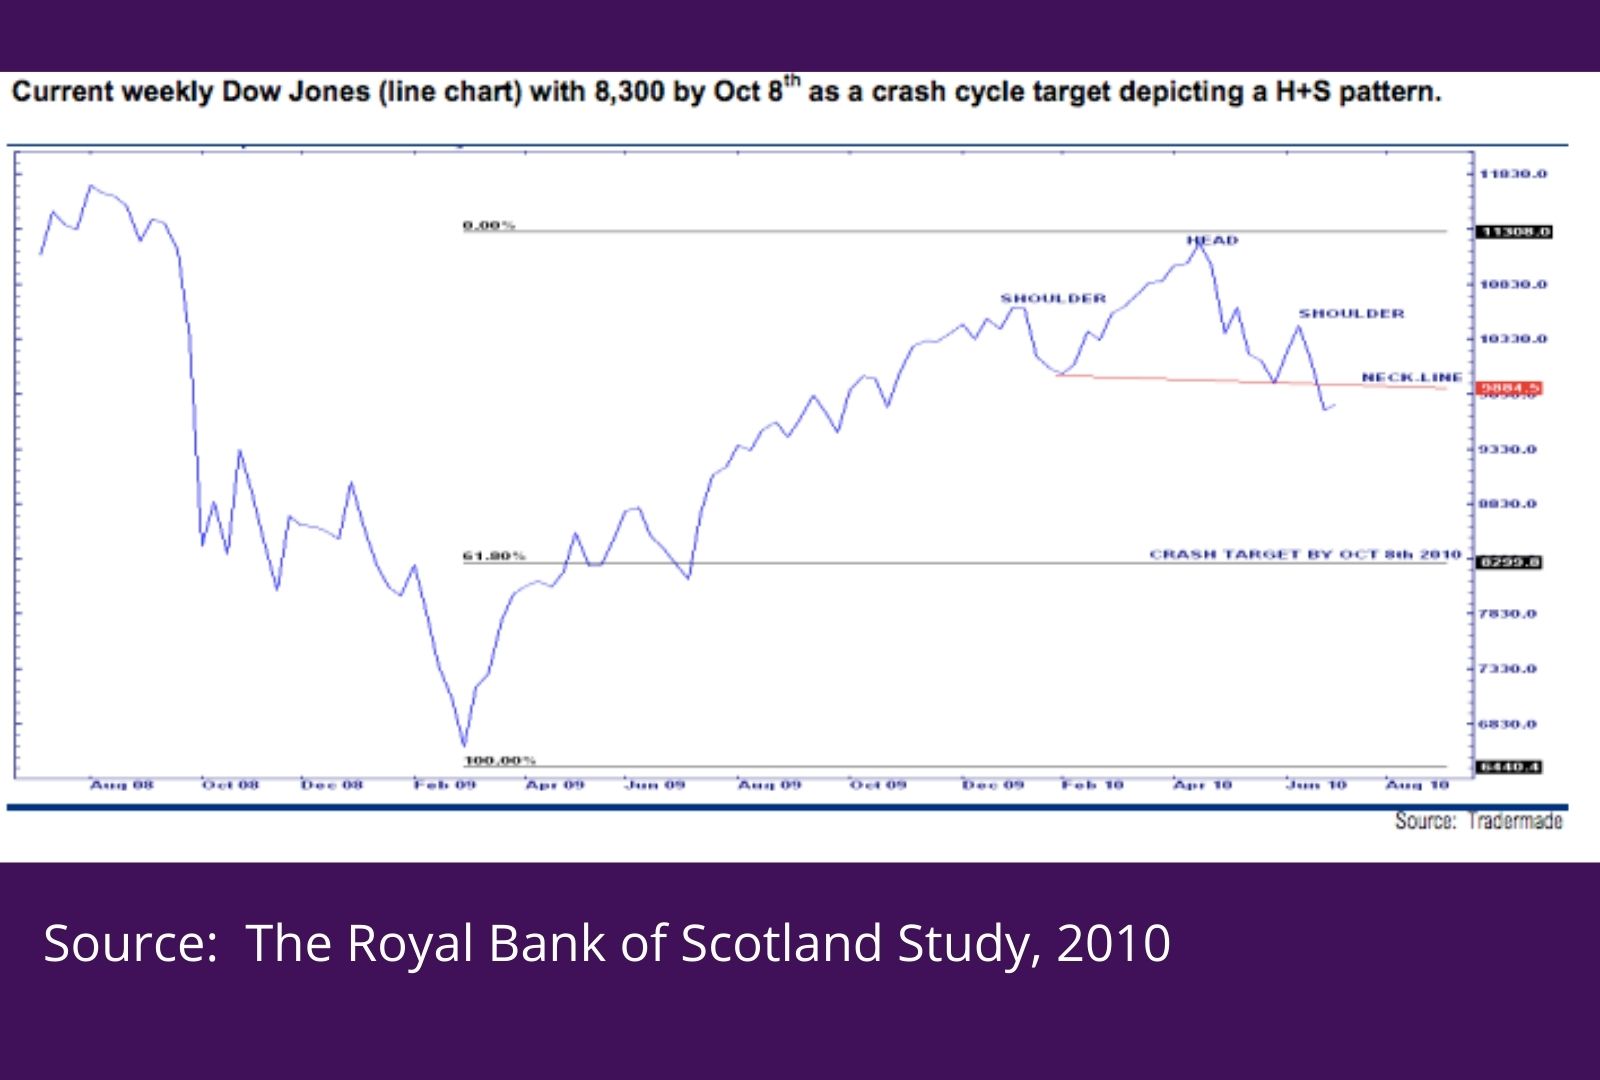
Here's the link to read the full study published by the Royal Bank of Scotland: https://www.markettiming.nl/img/image/file/RBS_MoonTrading13Jun10.pdf
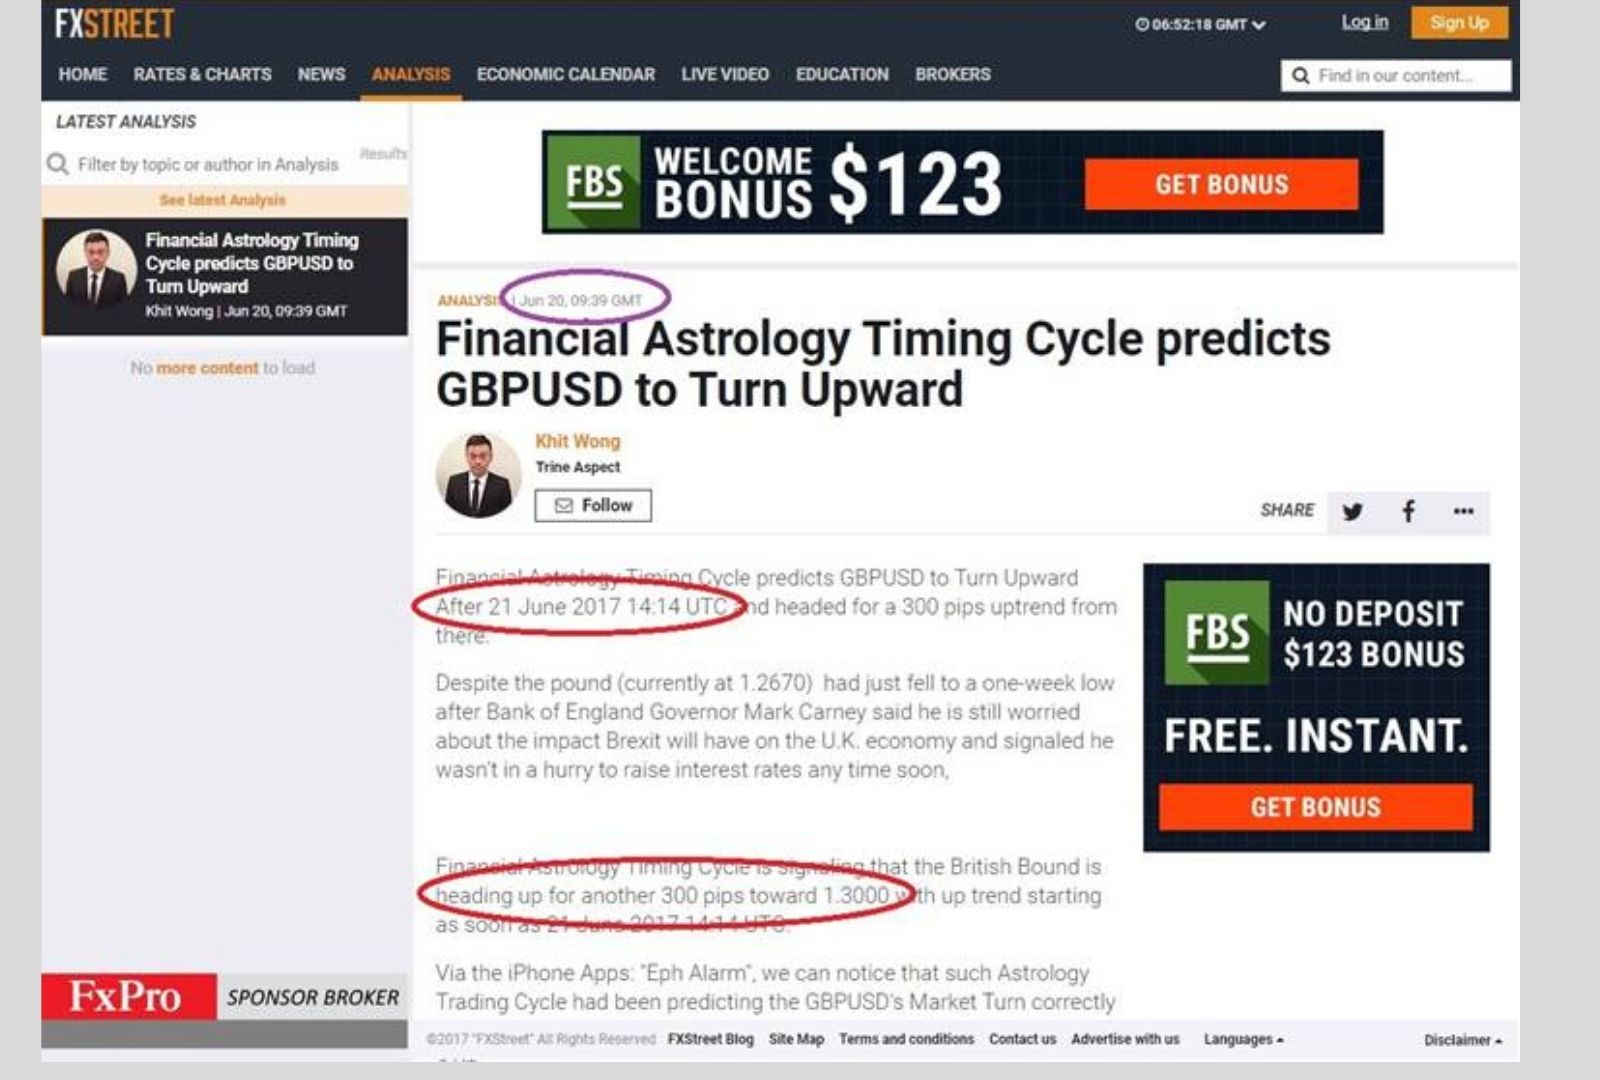
#3. Some timestamped trades on FXSteet that predicted the buy point down to Day and Minute!
There it is… You now hold the report card and paper trail of my trading career. I WANT to give you this skillset in the 4-Week W.D. Gann Trader Challenge. I’ve done the heavy lifting. Gann himself said, “The future is but a repetition of the past.” This challenge is simple and duplicatable on purpose. This way, you can place trades with confidence while “holding my hand” to learn along the way and not waste years figuring it out alone. My Math Trading Tool and Astro Trading Alerts take away the second-guessing hours spent flipping through your 12-inch pile of notes and being forced to figure it out alone.
You CAN do this…
Join the Challenge. Go. Do. Conquer. I’ve got your back… will you join me?
https://learn.gannexplained.com/trade-like-wd-gann-challenge