You Can’t Afford to Overlook this if You Want Consistent Trading Profits
The Royal Bank of Scotland Reveals a little known Wall Street Profitable Trading Techniques
If you’re frustrated with trying every technical indicator under the sun that ain’t making you money, you simply don’t want to miss this! I wish I came across this unorthodox Wall Street trading method & strategy when I was starting out trading and boy my trades did suck back then.
Preamble: I have studied technical indicators for years and programmed my own but ultimately they are profitable for a short time. I turned into a profitable trader after I discovered and mastered the trading methods cited in the Royal Bank of Scotland. I then published two books that predicted the 2012-2017 Gold Market turns with just 1-2 days difference. I then get featured in FXStreet and Stock & Commodities Magazine.
Click Here to read the Royal Bank of Scotland study on Moon Trading
In this post, I am going to show you:
- What is Moon Trading mentioned in the RBS Study?
- What are the Big Wins cited in the RBS study?
- The Two Elements of a 4-5 Figure Winning Trade and What You Need to Know
- The Astrology Solution – You can find Down to the Day/Minute Entry (Time-Stamped Examples included)
- The Mathematical Solution – Traction Trendline (a Non-Farm Payrolls LIVE Trade video included)
- The Power of Astro & Mathematical Method Combined – (a Time-Stamped Example included)
- Summary … and The Gifts for You DON’T WANT TO MISS!
The Royal Bank of Scotland (RBS) has been providing financial services since 1722. Click Here for the study. The Moon & Planetary trading that was researched by RBS contained the #1 Winning Trading Techniques taught by a late Wall Street Legendary Trader, W.D.Gann. For those who haven’t heard of W.D. Gann predicted the fall of the 1929 Stock Market Crash a full year in advance. He helped his clients to short sell the market and made a ton of money. Mr. Gann then sold a ‘Master Course’ to private students for a cost of US$5,000 (that’s more than $50,000 in today’s dollars)! A fraction of what W.D. Gann taught as part of the trading techniques researched in this RBS study.
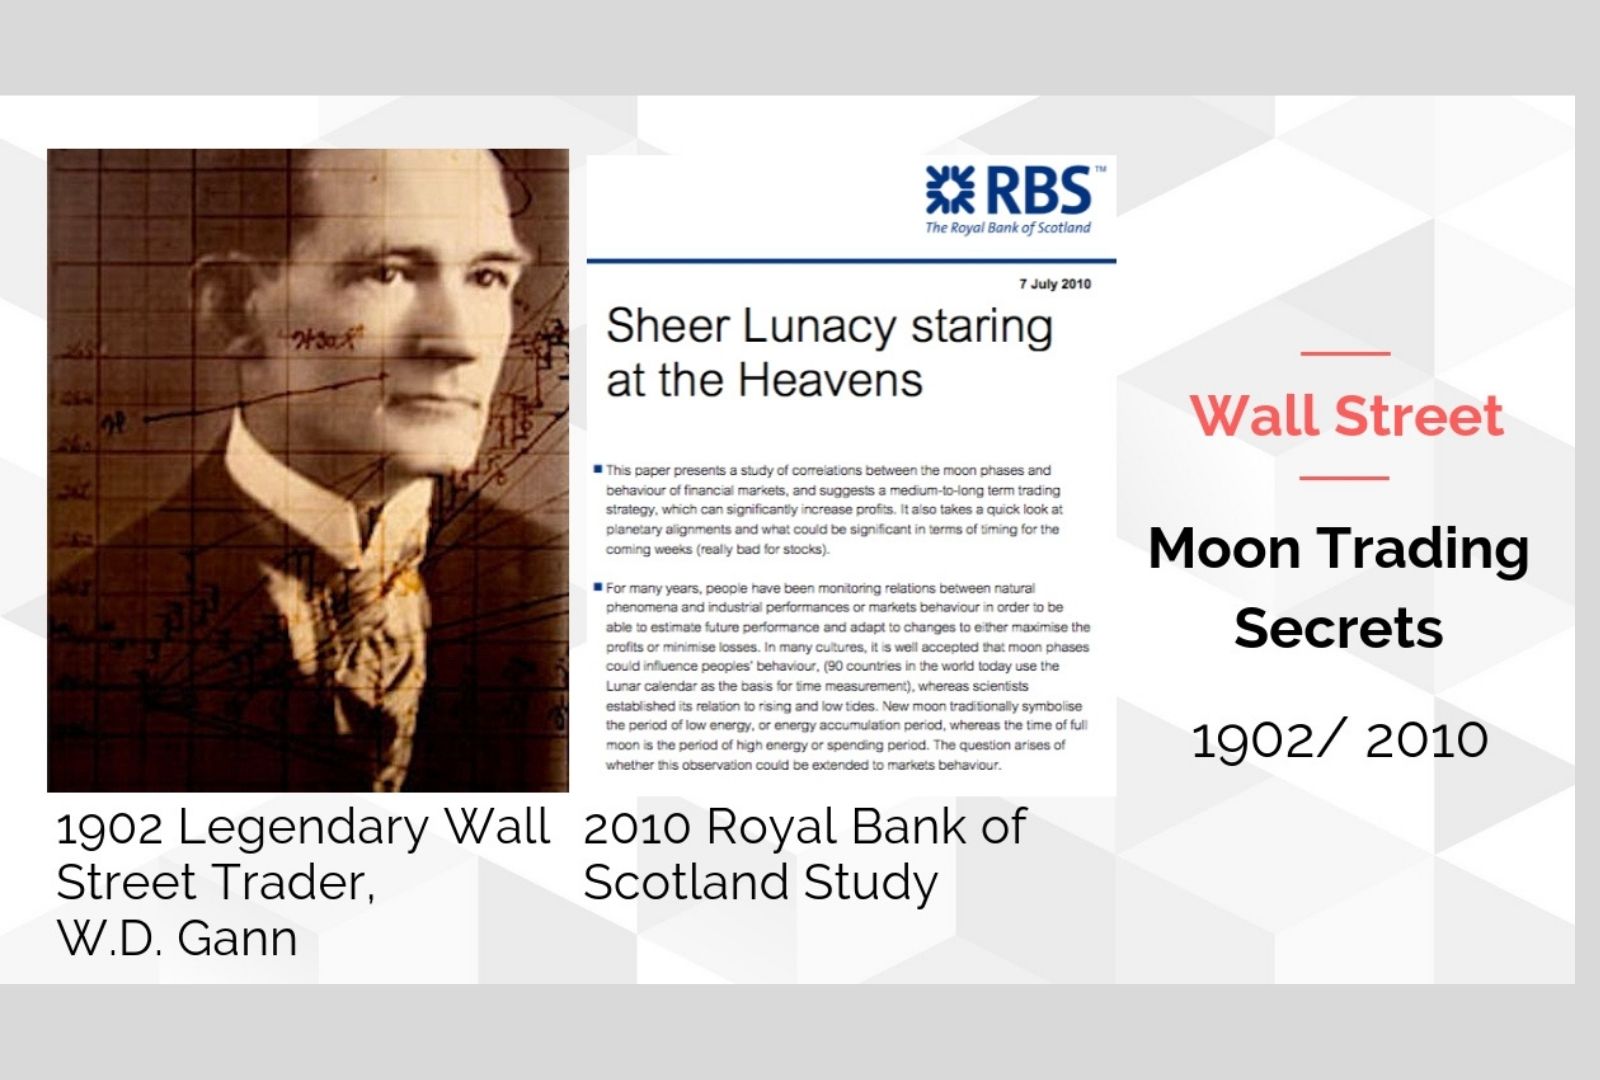
Source: The Royal Bank of Scotland RBSMarketPlace, Sheer Lunacy staring at the Heavens, 7 July 2010
Click Here to read the Royal Bank of Scotland study on Moon Trading
1. What is Moon Trading? (as mentioned in the RBS study)
The research conducted by RBS supports the theory of a positive correlation between index prices and moon phases, and if you apply this model to your trading, you can significantly increase your trading profits. This study was conducted over a period of several decades on the performance of 6 indices FTSE 100, S&P 500, DAX, EURO XX 50, Hang Seng, and the CAC 500.
2. What Are the Big Wins cited in the RBS Study?
Here’s some interesting facts quoted from the RBS study:
#1. With an investment of £1,000 on FTSE in 1984, and applying the Moon Trading strategy, i.e buying on the new moon and selling on the full moon, it would be worth £12,116 in 2010, more than double the profits vs the index performance.: £11,116 vs £4,130
2. Certain planetary alignments preceded the 1987 and 2008 market crashes and you could short the market with a big fat profit just like what W.D. Gann did right before the Stock Market crash
Can I apply this to my trades?
The short answer. Absolutely.
The longer answer. Read on to find out how.
The most simple kind of Moon Trading as mentioned in the RBS paper is: Buy on the new moon and sell on the full moon. There are 90 countries in the world today using the lunar calendar as the basis for time measurement because the moon phases could influence people’s behavior. The new moon traditionally symbolizes the period of low energy, or energy accumulation and the full moon is the time of high energy or spending period.
3. The Two Elements of a 4-5 Figure Winning Trade and What You Need to Know
The data in the study indicated the outperformance of moon-investing over ordinary investing is raised at an increasing rate in rising markets, however, it also falls sharply in a falling market.
What that means is, that the Moon Trading strategy significantly outperforms the index in a rising market. The questions arise on:
[1] How this strategy would behave in pure falling markets?
[2] How can I foretell whether the market is falling, rising, or range-bound?
[3] How can I apply this profitable technique to smaller time frames? Intraday or swing trading.
Do you want to know my secret sauce? There are both astrological and mathematical solutions to the above questions so let’s take a look at them.
4. The Astrological Solution – You can find Down to the Day/Minute Entry
(Time-stamped Examples Included)
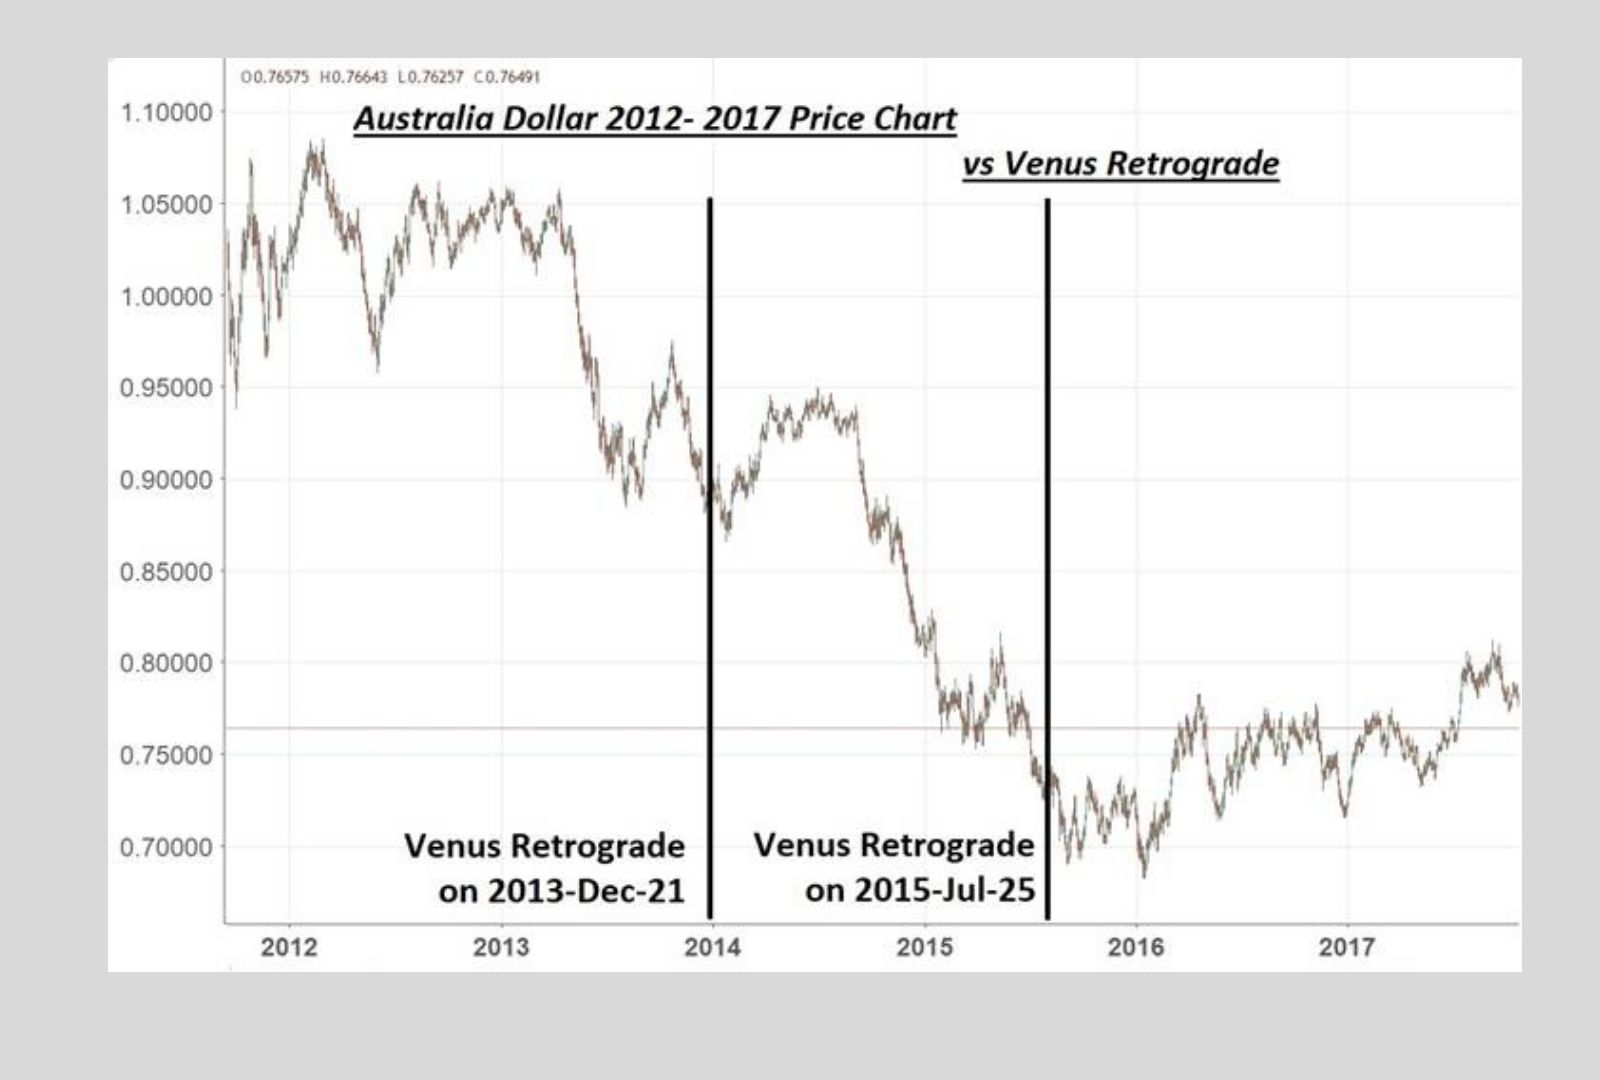
Let me share with you another proven astrological method based on W.D. Gann’s trading secrets – Retrograde trading. Like moon trading, this is another common astrology trading tool used to predict market lows and bottoms or market reversals.
So, what is Retrograde?
It means when the planet is directing backward vs moving forward. And if it happens, it will release an opposing force or energy on earth vs the normal days.
Don’t take my word for it. Here’s my time-stamped forecast, published in my Trading Books:
#1 – I predicted the Australian Dollar bottom that occurred quickly after Venus Retrograde during 2012 – 2017.
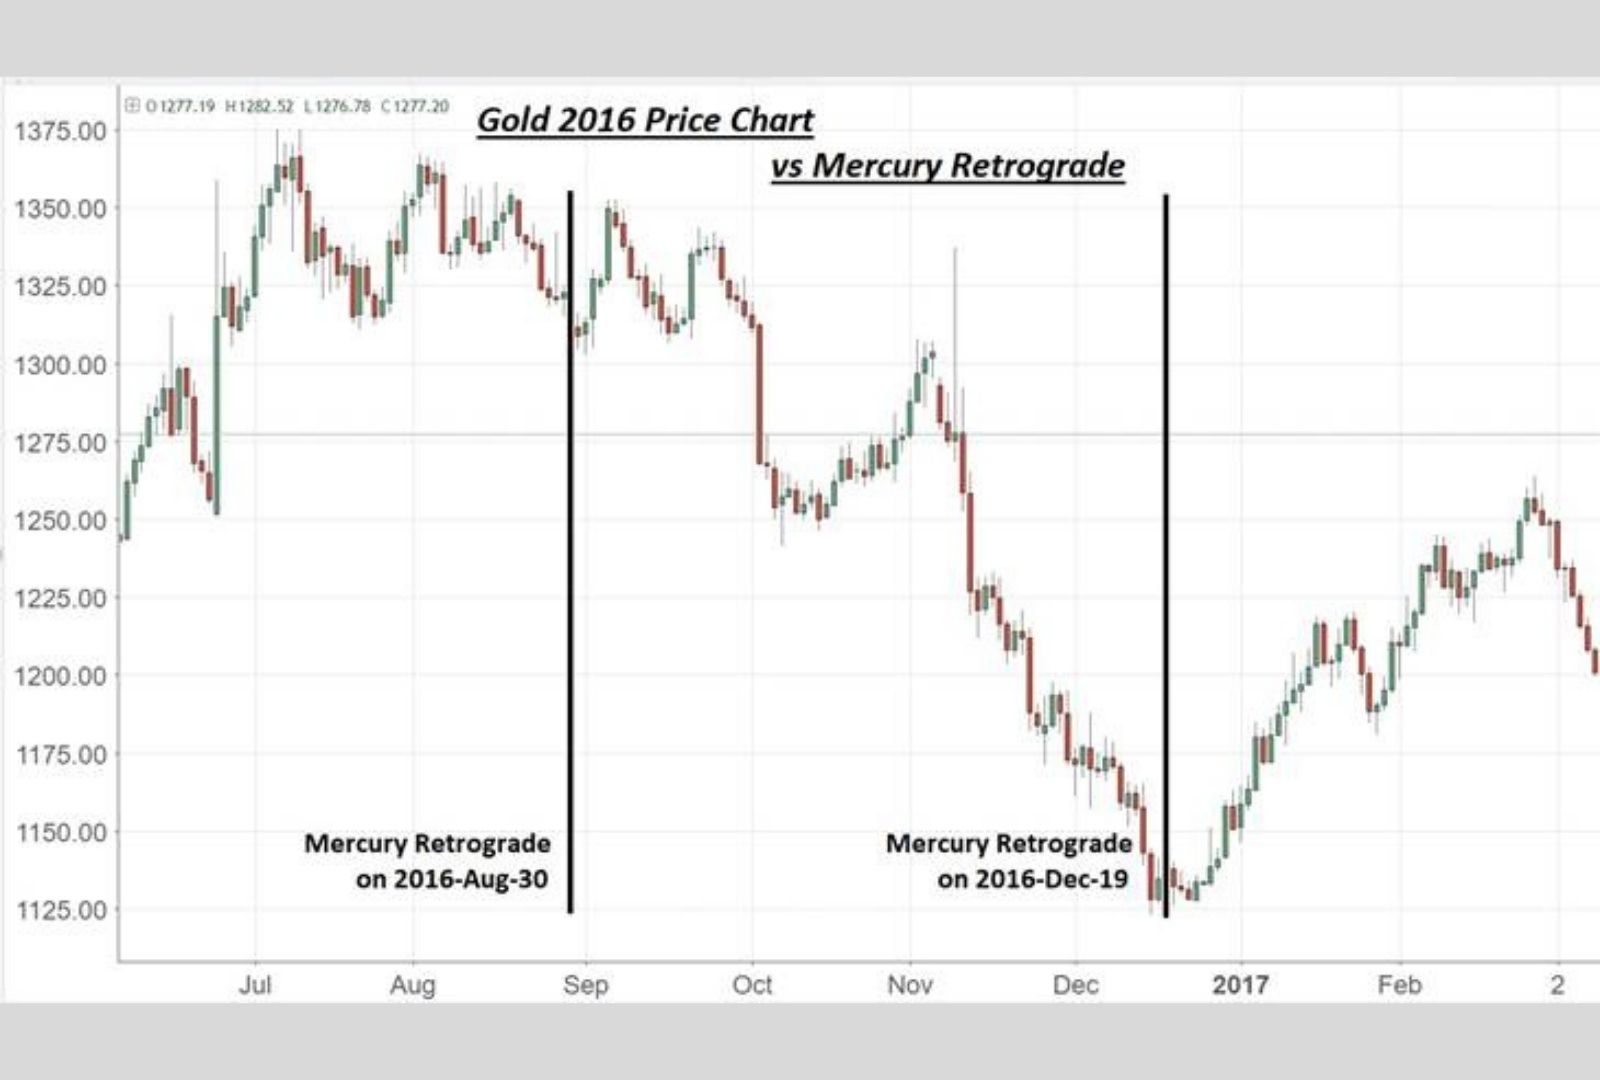
#2 – I predicted the Gold Market reversal with Mercury Retrograde to the exact day in 2016.
5. The Mathematical Solution – Traction Trendline on How to Spot the Trade Entry with No Ambiguity (a Live Example included)
You probably will be interested to know how to find the direction of the trends, and how to spot the exact entry of the trade with no ambiguity on a shorter time frame or intraday level. Here’s a live example to apply my patented Traction Trendline on a post-Non-Farm Payrolls EUR.USD Trade on November 3, 2017, on a LIVE WEBINAR.
Here’s a live example to apply my proprietary Traction Trendline on a post-Non-Farm Payrolls EUR.USD Trade on November 3, 2017, on a LIVE WEBINAR.
6. The Power of Astro & Mathematical Methods Combined (a Time-Stamped Example included)
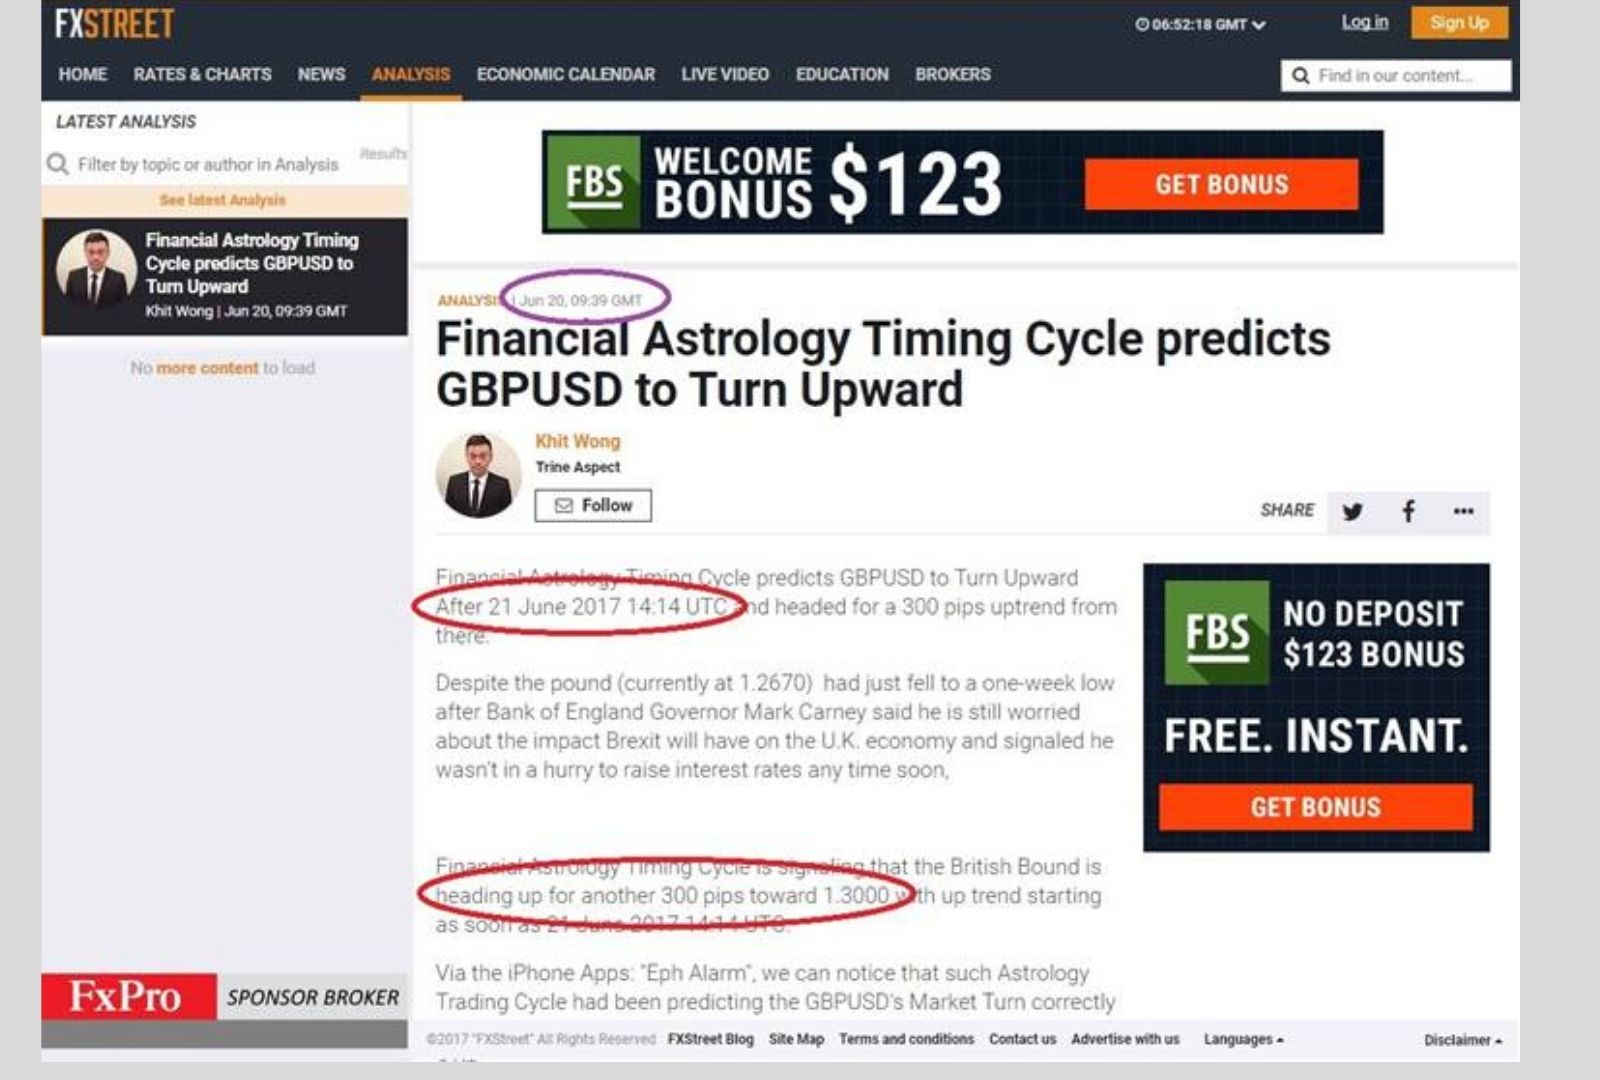
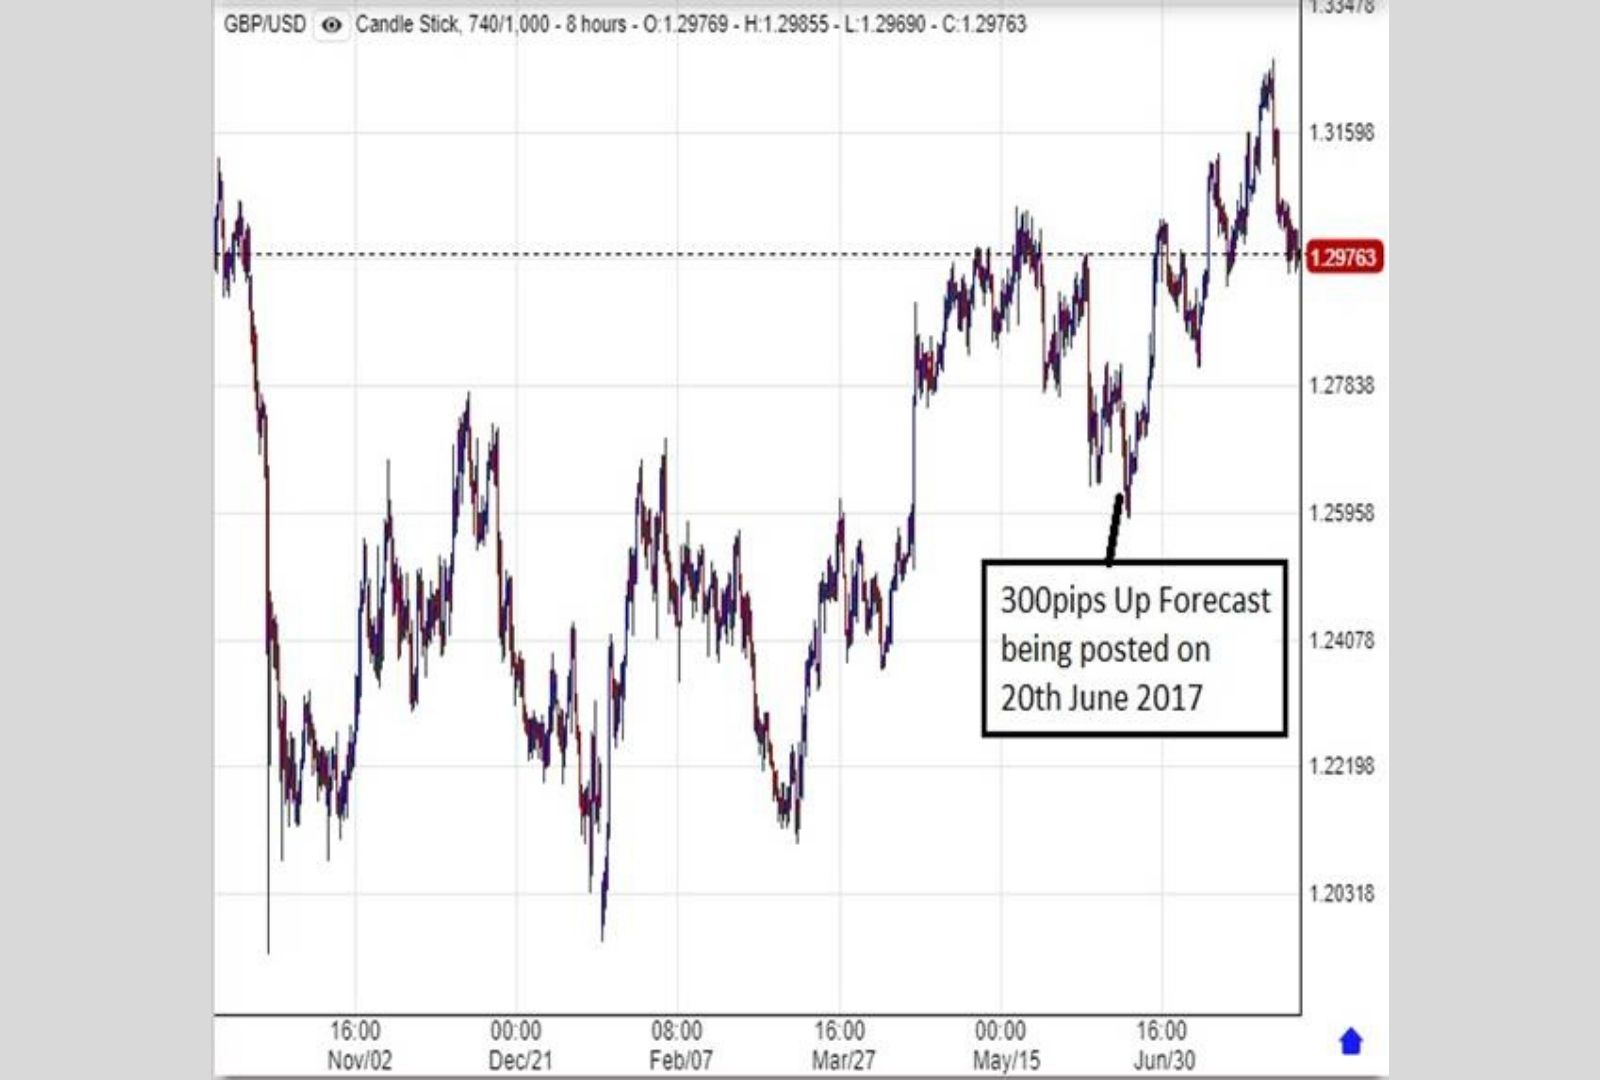
I combined the astrological and mathematical timing techniques to identify a market setup and predicted a 300 pip move on a timestamped FXStreet forecast on June 20, 2017.
The Astro & Mathematical Methods Combined (a Time-Stamped Example included)I combined the astrological and mathematical timing techniques to identify a market setup and predicted a 300 pip move on a timestamped FXStreet forecast on June 20, 2017.
Now you’ve discovered how I do moon & retrograde trading, including my unique patented Traction Trendline.
You’ve learned that these three tools make spotting the specific market entry so simple and deliver a maximum reward-to-risk ratio, which I consider the secret sauce of my trading career. When you’re able to master all three techniques and can continuously engage in these High return Small risk opportunities, you can take the fear out of your trading and finally start getting consistent profit from the market.
I know you’ve got a dream of becoming a successful trader, and I’m here to tell you that it’s doable!
The above might seem daunting to you. And you’re right. Over the last year, I created a course that helps traders break through the above challenges. It’s called the Trading Genius Formula course.
I WANT to give you this skillset in the Astro Reset Masterclass. I’ve done the heavy lifting. Gann said, “The future is but a repetition of the past.” This challenge is simple and duplicatable on purpose. This way, you can confidently place trades while “holding my hand” to learn and not waste years figuring it out alone. My Mathematical Trading Tool and Astro Trading Alerts take away the second-guessing hours spent flipping through your 12-inch pile of notes and being forced to figure it out alone.
You CAN do this…
Join the Challenge. Go. Do. Conquer. I’ve got your back… will you join me? Sign up here for the Astro Reset Masterclass