Learn From The Modern Day W.D. Gann. 3 Powerful Reasons Why.
Meet the billionaire Jim Simons, the wealthiest mathematician behind the world’s most successful hedge funds empire- Renaissance Technologies. The secretive US $75 billion hedge fund, vastly outperformed Warren Buffet over the past 30 years.
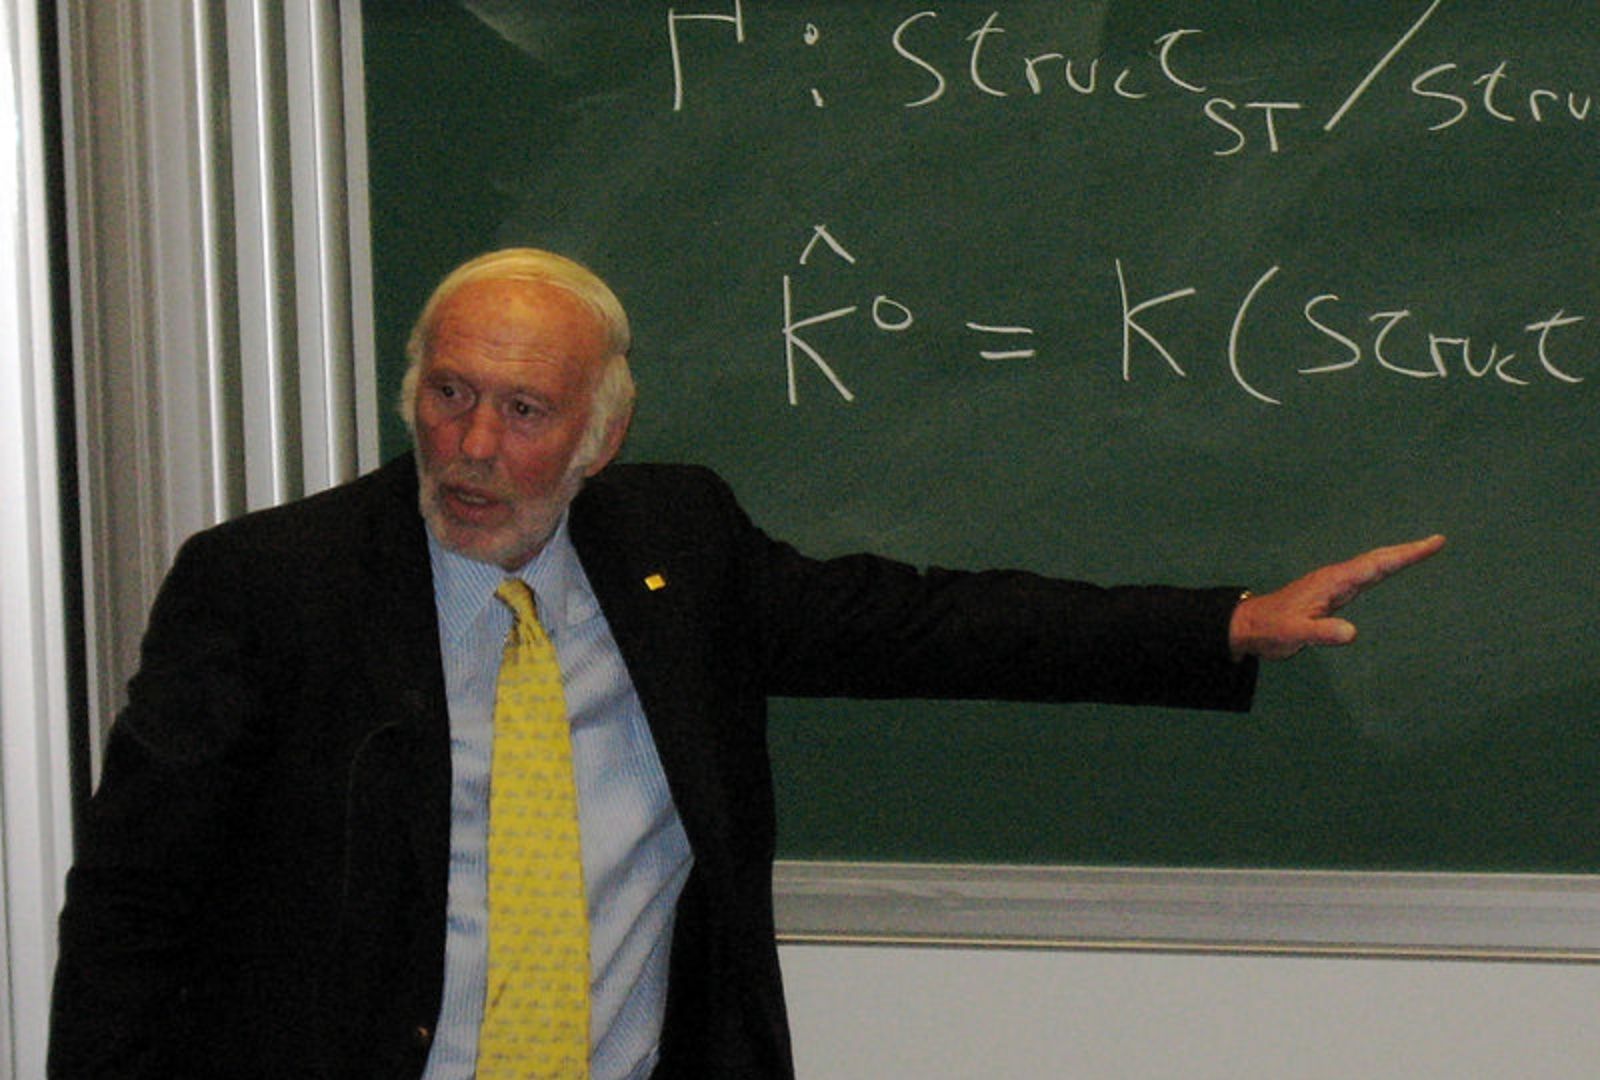
Like WD Gann, he is a mathematics genius who is into astronomy, physics, and natural law:
- Unlike typical investment banks, he hires mathematicians, statisticians, computer scientists, astronomers, and physicists to work for him.
- Renaissance researchers have explored whether weather, sunspots, and lunar phases influenced the financial markets.
- The predictive signals used by Renaissance are closely guarded secret; he joked in a speech he gave at Princeton.
Exciting? Let’s see what we can learn from him.
#1. The Power of Mathematics
W.D Gann used mathematics, geometry, and natural cycles to predict market movements. Similarly, Mr. Simons is a mathematics genius.
Jim Simons once taught at MIT & Harvard and developed an academic theory that combines geometry and topology with quantum field theory. One of the 2016-newly-found-asteroids is named in honor of his contribution to modern physics. He also won the Oswald Veblen Prize in Geometry and was elected National Academy of Sciences – he now rivals almost anybody in the world of Geometry.
His firm, Renaissance Technologies, has been called “the best physics and mathematics department in the world”, and they have produced some great results. Renaissance’s Medallion fund has returned more than 39% each year over 20 years.
For that, they are qualified to charge a 44% performance fee on top of its 5% management fee.
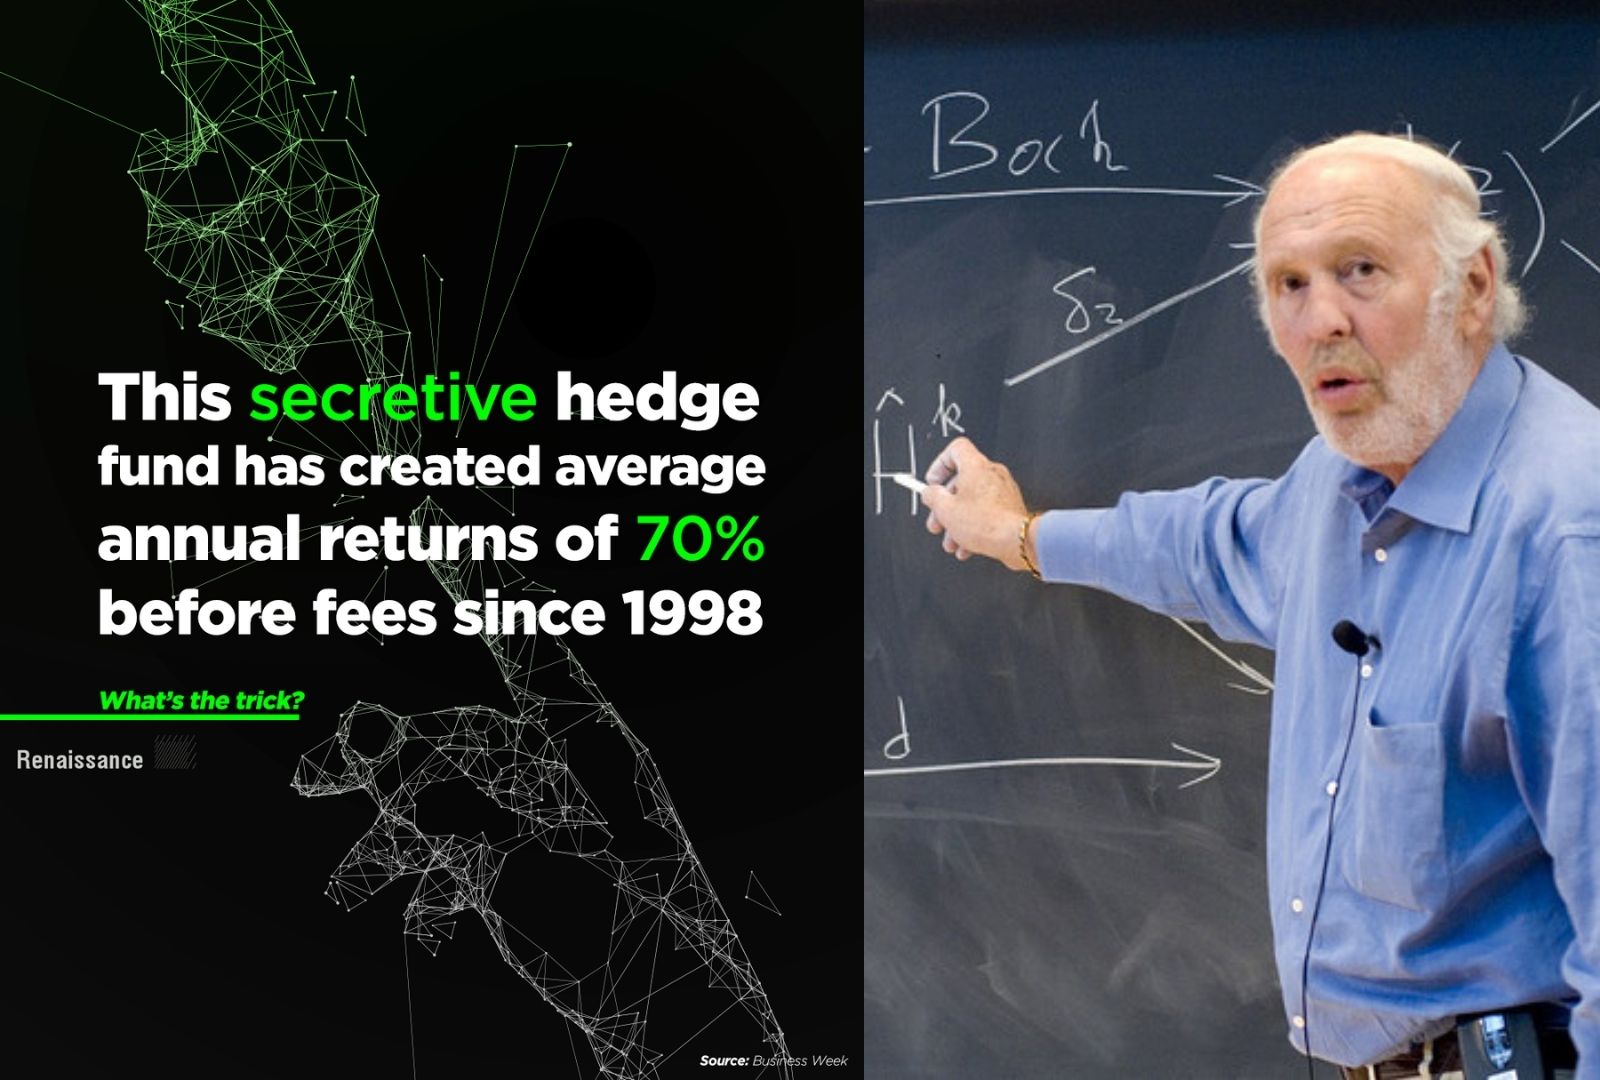
Source: Bloomberg.com Nov 12, 2019, The Unsolved History of the Medallion Fund
Do the math – If you had invested $1000 into Medallion in 1988, you would have today, after fees, around $23MM.
Key Insights:
I know that Astrology is fascinating, but don’t underestimate the power of mathematics. The truth is Mathematics gives you consistency and, most importantly, the foundation to make astrology work.
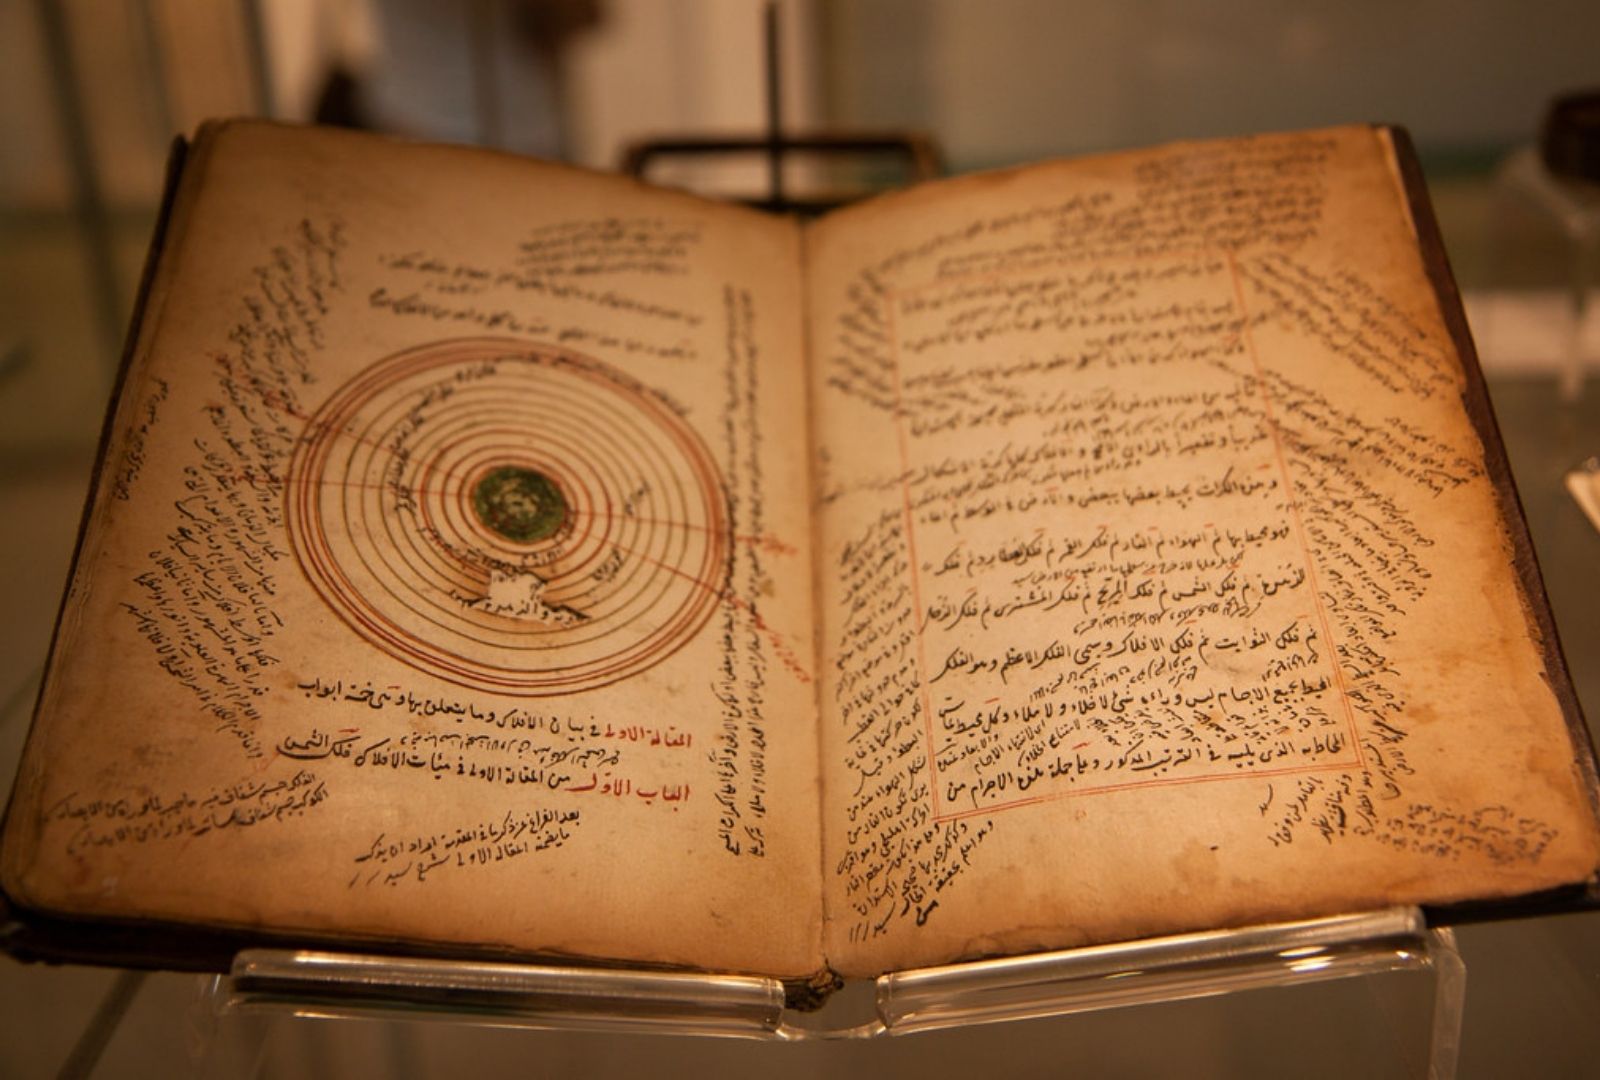
This was exactly what W.D. Gann said in The Ticker and Investment Digest Interview 1919. “An astronomer can predict to the minute when an eclipse is going to occur, but you would not consider him a prophet, would you? Of course not. He simply makes use of mathematics based on known laws of the movements of the planets in their orbits.”
My point is, don’t skip steps! You need to have both firmly under your belt to be a wildly profitable trader.
#2. History Repeats Itself because that’s the Natural Law
Simons was a Mathematics professor and worked for NSA (National Security Agency), helping them crack codes. He took his code-cracking skills into trading. He used machine learning to analyze the market, using historical data, backtesting, and comparing it to all kinds of things, including the weather and astronomy.
Here’s what he said in late 2015 with Chris Anderson on TED, the mathematician who cracked Wall Street:
13:22 “Weather, annual reports, quarterly reports, historical data itself, volumes, you name it. Whatever there is. We take in terabytes of data a day.”
16:22 “Well, it’s not just mathematical. We hire astronomers and physicists and things like that. I don’t think we should worry about it too much. It’s still a pretty small industry. And in fact, bringing science into the investing world has improved that world. It’s reduced volatility. It’s increased liquidity. Spreads are narrower because people are trading that kind of stuff. So I’m not too worried about Einstein going off and starting a hedge fund.”.
Simons once joked about this – “Of course, I’m not going to tell you the various predictive signals — Unless… No, I’m definitely not.”
He has admitted that Renaissance researchers have explored whether sunspots and lunar phases influenced the financial markets – but he wouldn’t say what they found.
Do his ‘best-kept secrets’ remind you of WD Gann?
Gann was a big believer in everything that has happened before and will eventually repeat itself. Gann studied ancient geometry, astronomy, and astrology to investigate how market events and specific numbers were repeated across various time cycles.
Gann’s wisdom on ‘History Repeats Itself’ continues to age well as proven by the incredible success of the Math Genius – ‘Past performance is a predictor of future success.’ Jim Simons said.
Key Insights:
“Every movement in the market is the result of a Natural Law and of a Cause which exists long before the Effect takes place and can be determined years in advance,” Gann said.
It has inspired me to dive deep into Natural Law. Since then, I have read all sorts of literature from quantum physics, fractals, biology, weather patterns, history, Bible, and ancient literature to Chinese astrology.
Living in a typhoon-prone city, I noticed that the price movement in the market is very similar to the typhoon’s formation. As an FYI, the typhoon is very much like a hurricane in the US.
Days in advance, when the typhoon is approaching 1500km from Hong Kong (and still fairly weak), we start to get notifications from the weather observatory. When the storm is 200 km away, a No. 8 signal will hoist, and school and work will suspend.

Like the formation of a typhoon, the market takes time to evolve and hit the ‘low’ price (just like the example of a typhoon hitting Hong Kong). It turns out some implicit rules are guiding how the price grows/decays in a bear campaign.
What does this tell us? A typhoon won’t suddenly turn from weak to strong – It takes TIME for the storm to pick up moisture from the sea to GROW into a full-blown typhoon.
Can you see the parallel with financial markets? For example, a currency cannot drop 1400 pips in one trading day; it takes TIME for the market to ‘grow’ to that price target, it cannot do it within a few seconds!
Isn’t that what Gann said about a Bear Campaign?
Like the formation of a typhoon, the market takes time to evolve and hit the ‘low’ price (just like the example of a typhoon hitting Hong Kong). It turns out some implicit rules are guiding how the price grows/decays in a bear campaign.
#3. The Market is Inefficient and how Physics and Mathematics can Solve the Problem.
“Efficient market theory is correct in that there are no gross inefficiencies, but we look at anomalies that may be small in size and brief in time.” – Jim Simons
He gave a great example of how his trading style in one of his interviews and his main trade window is about 2-3 days, that is, buy, hold 2-3 days, and exit.
‘I said the average a holding period of about two days they do trade much more frequently, but that’s usually when they’re establishing positions or getting out of position so they’ll do rapid-fire trades to put on a trade they’ll break up the trade so that will seem like they’re really rapid-fire high-frequency type operation, but those are again just getting into positions, and yes some are a little bit longer they’ll do minutes to two months is the way they describe it but on the average is about two days.” Simons said.
Key Insights:
What does it tell you? There are some ‘recognizable’ patterns for entries and exits, and the market has more inefficiencies than the vast majority assumes.
Let’s use a real example to illustrate this point – the famous George Soros’ 3 billion win trade.
Here's how it goes – Bank of Japan announces more easing back on Oct 30th, 2012.
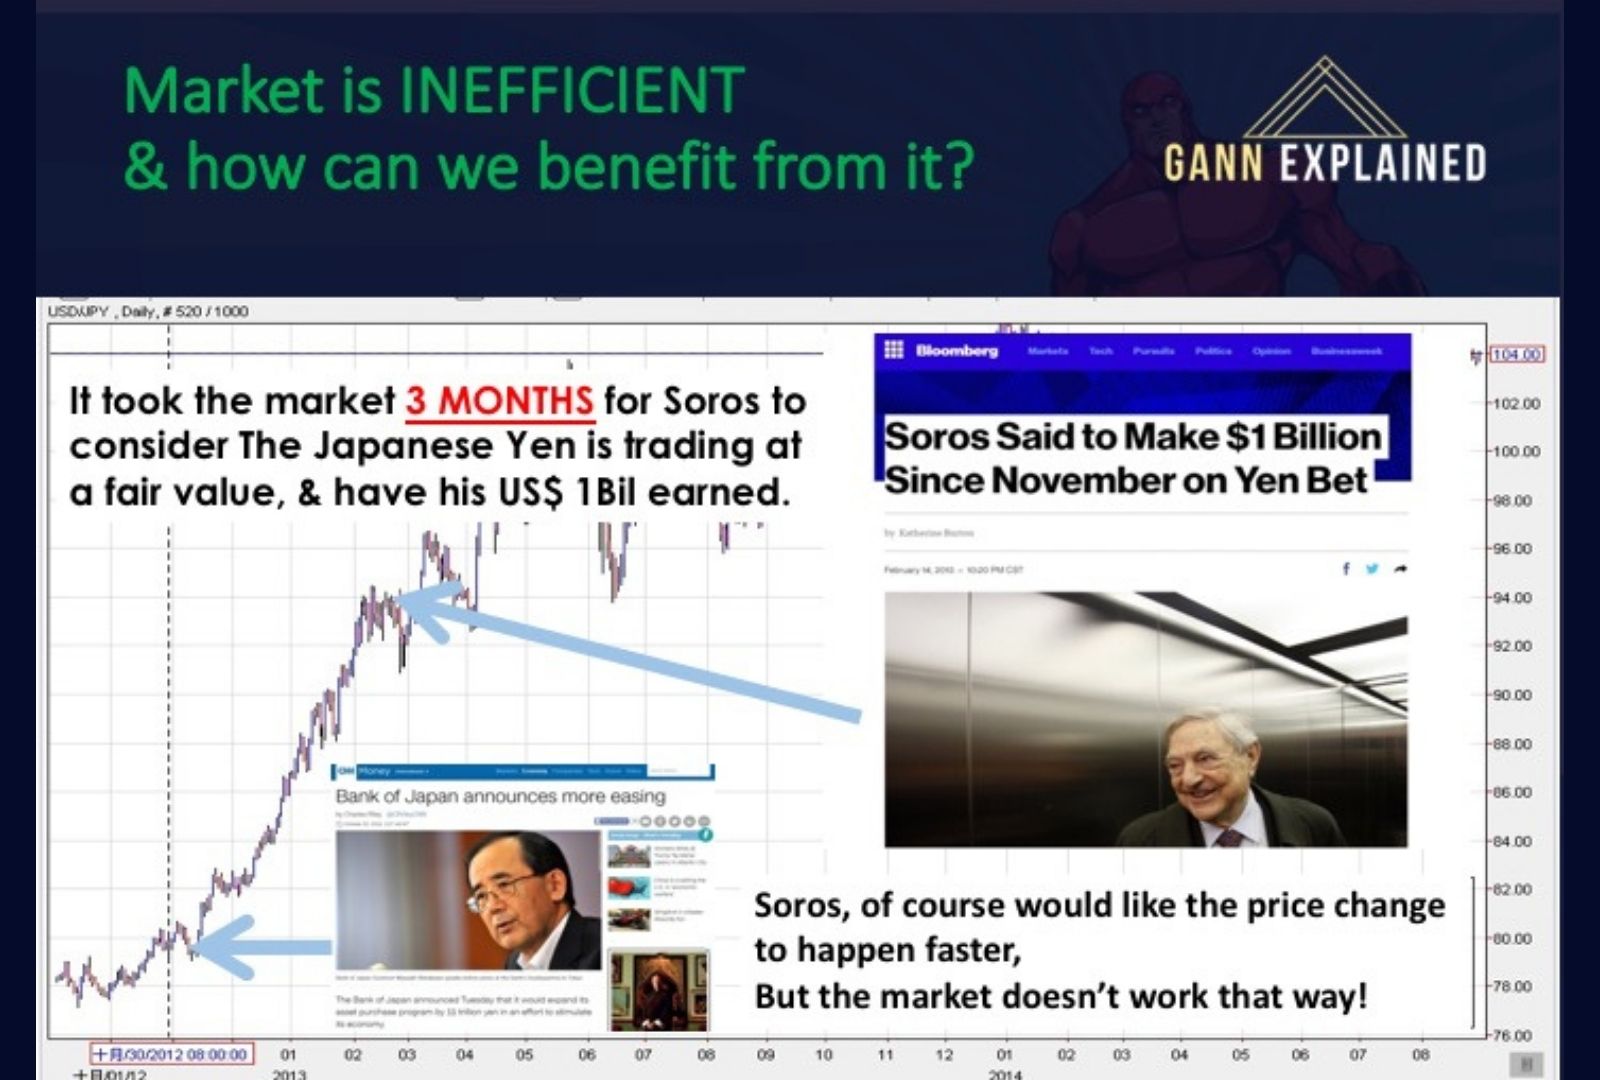
Three months after, Soros told Bloomberg he had made $1 Billion since November on Yen bet.
That’s an excellent example of the Market is Inefficient – it took the market 3 MONTHS to price in for the Japanese Yen to trade at a fair value.
The Efficient Market Hypothesis states that asset prices fully reflect all available information.
Imagine for a second, what could have happened if the market is efficient in this news?
The yen will drop 10% in a SECOND
Japanese STOCK Market should have risen by at least 10% in a SECOND
Traders who short sell the market without hedging will go BANKRUPT right away
Japanese electronic products selling around the globe will be 10% cheaper
Like what I’ve said above, there is an implicit trend that guides the market to unfold, and it takes time for the market to grow to the Ultimate Price Target.
Isn’t that what Isaac Newton said in the Third Law of Motion? – “For every action, there is an equal and opposite reaction.”
https://learn.gannexplained.com/wd-gann-trader-challengeTakIt is precisely what I teach in Trading Genius Formula, the secrets of predictions behind the trend action and reaction:
“When a Decline in Points Exceeds the Greatest Decline of a previous Reaction by one or more points, it is an indication of a Change in Trend.” W.D. Gann.
Exciting? The good news is, that you can apply a profitable mathematical model to your trades even if you’re not a mathematician, codebreaker, or physicist. I have created a value offer for you. I WANT to give you this skillset in the 4-Week W.D. Gann Trader Challenge. I’ve done the heavy lifting. This challenge is simple and duplicatable on purpose. This way, you can place trades with confidence while “holding my hand” to learn along the way and not waste years figuring it out alone. My Math Trading Tool and Astro Trading Alerts take away the second-guessing, hours spent flipping through your 12-inch pile of notes, and being forced to figure it out alone.
Join the Challenge. Go. Do. Conquer. I’ve got your back… will you join me? You can sign up here: https://learn.gannexplained.com/trade-like-wd-gann-challenge
If you're an avid Gann Trader: check out the free video training here: https://training.gannexplained.com/

