Discover How To Calculate the Price, Time, and Direction Of Market Turns Even If You’ve Tried All Planetary Combinations And Aspects But Still Can’t Make Money!
If you’ve been looking for an Astrological Solution for Squaring Time and Price, this is for YOU!
If you are struggling with how to figure out the correct planetary combination to use for a particular market to calculate the price & time to enter and exit a trade,
Or how to accurately determine the direction of the turn at the correct planetary aspect,
And why aspects suddenly fail to work or inversion happens,
You might be well researching Gann’s work for a couple of years. Sadly, you hit a brick wall with the polarity and price level calculation.
This could be the most important message you have ever read.
You might be already using Astro charting software like Galactic Trader, SolarFire, Timing Solution, and Wave 59 to plot planets and aspects but still haven’t figured out the right turns.
You’ve got so many lines on the screen, and you don’t have any idea when it hits and which line you buy or sell.
Half of the time it blows right through those lines or levels, so you don’t know if it was any good or valid.
You never would know where it turns high, low, or surges, and you probably have no ability to identify the price.
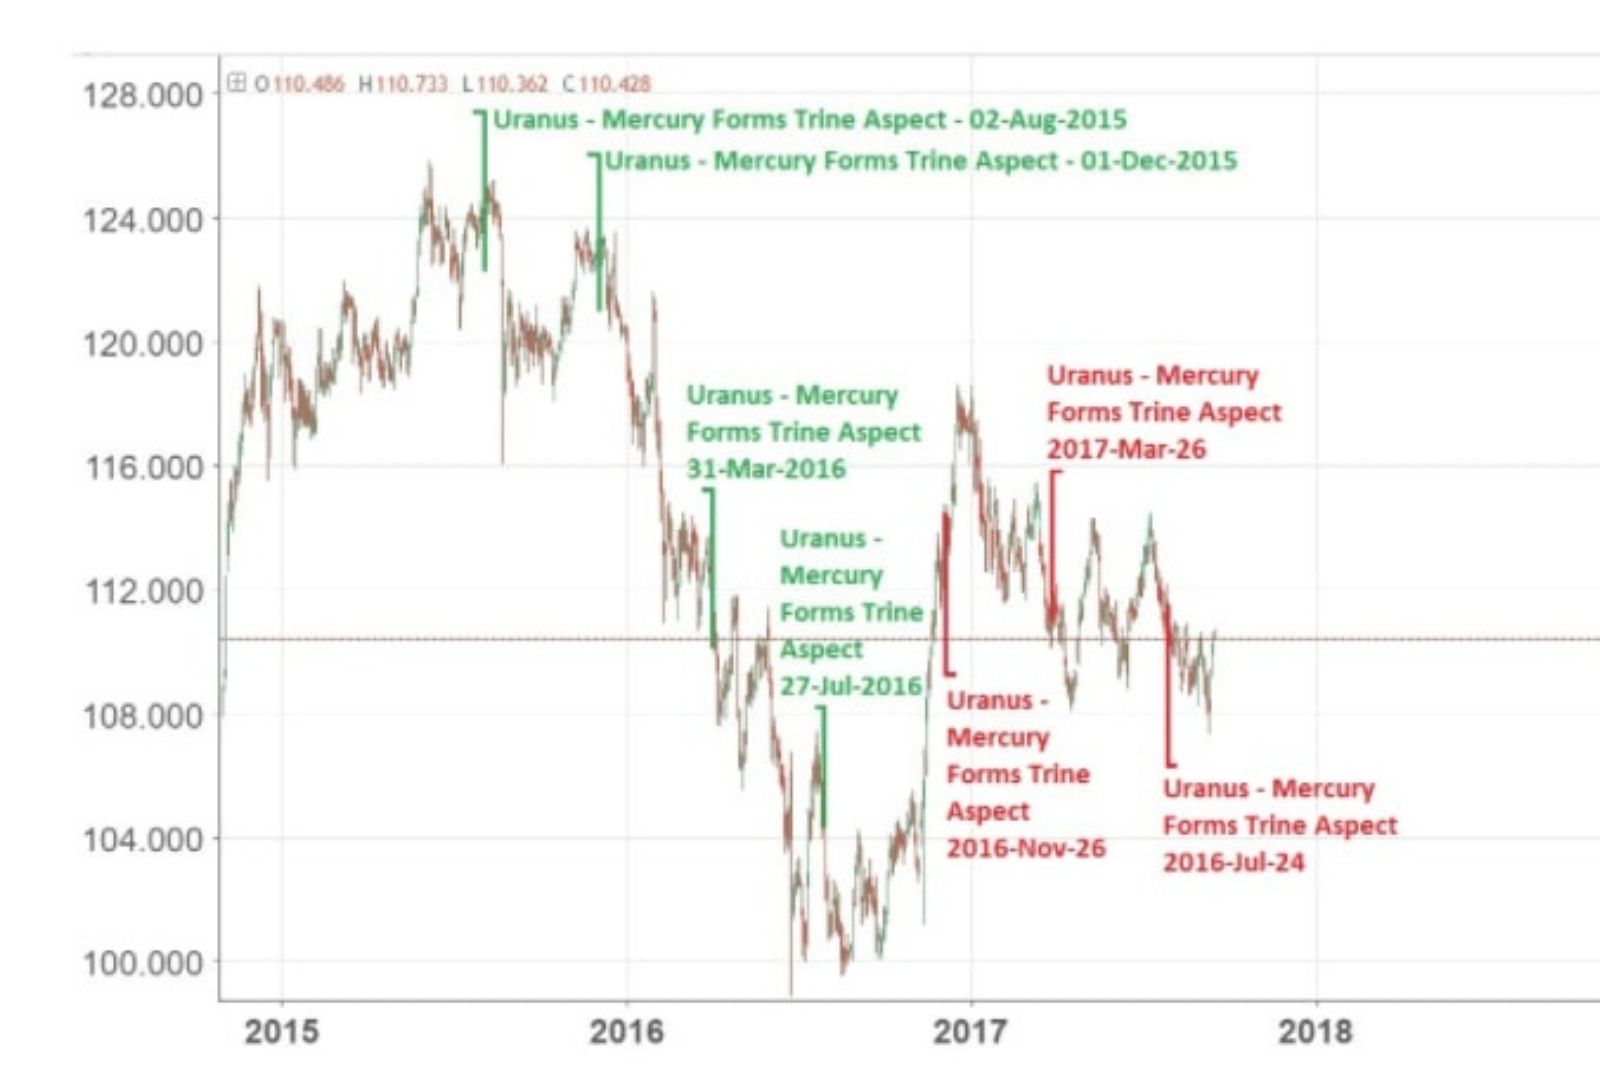
You might be able to identify some trigger points using SolarFire, see some really amazing things, and make some money with it, like the chart below. USD.JPY made a top when Uranus trine Mercury, followed by a sharp decline of 80-100 pips 4 times in a row.
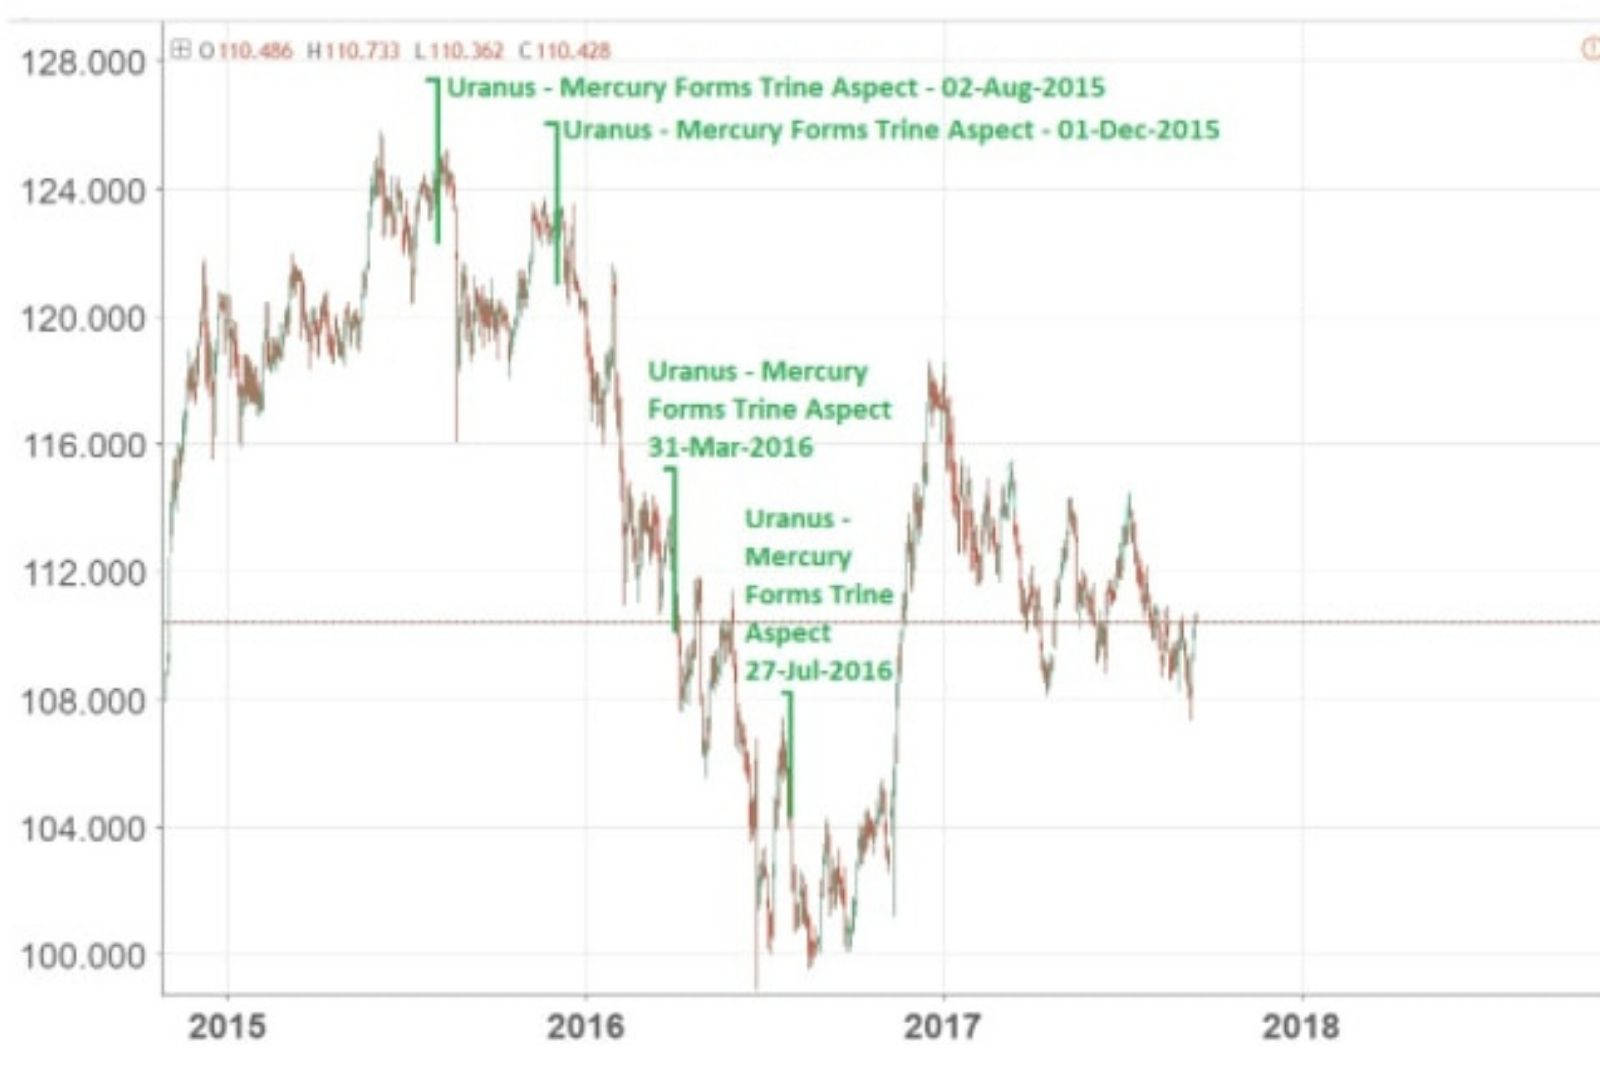
Good money. The best part is that you’ve cracked the secret code and can short USD.JPY and make 100 pips whenever Uranus is trine to Mercury.
Hell YA!
You’ve seen it hit right on the money several pivots in a row then all of a sudden, it stops working!!
The point is, you might be able to make some money, but it’s not going to do it forever as soon as planets or aspects suddenly stop working and inversion happens.
Even if you figure out the turn, you might not have the confidence to hold it long enough.
You might also have come across Square of Nine on Metatrader. The support/resistance levels are generated using the values in Gann square, and breakouts of the levels are used to enter intraday or swing trades.
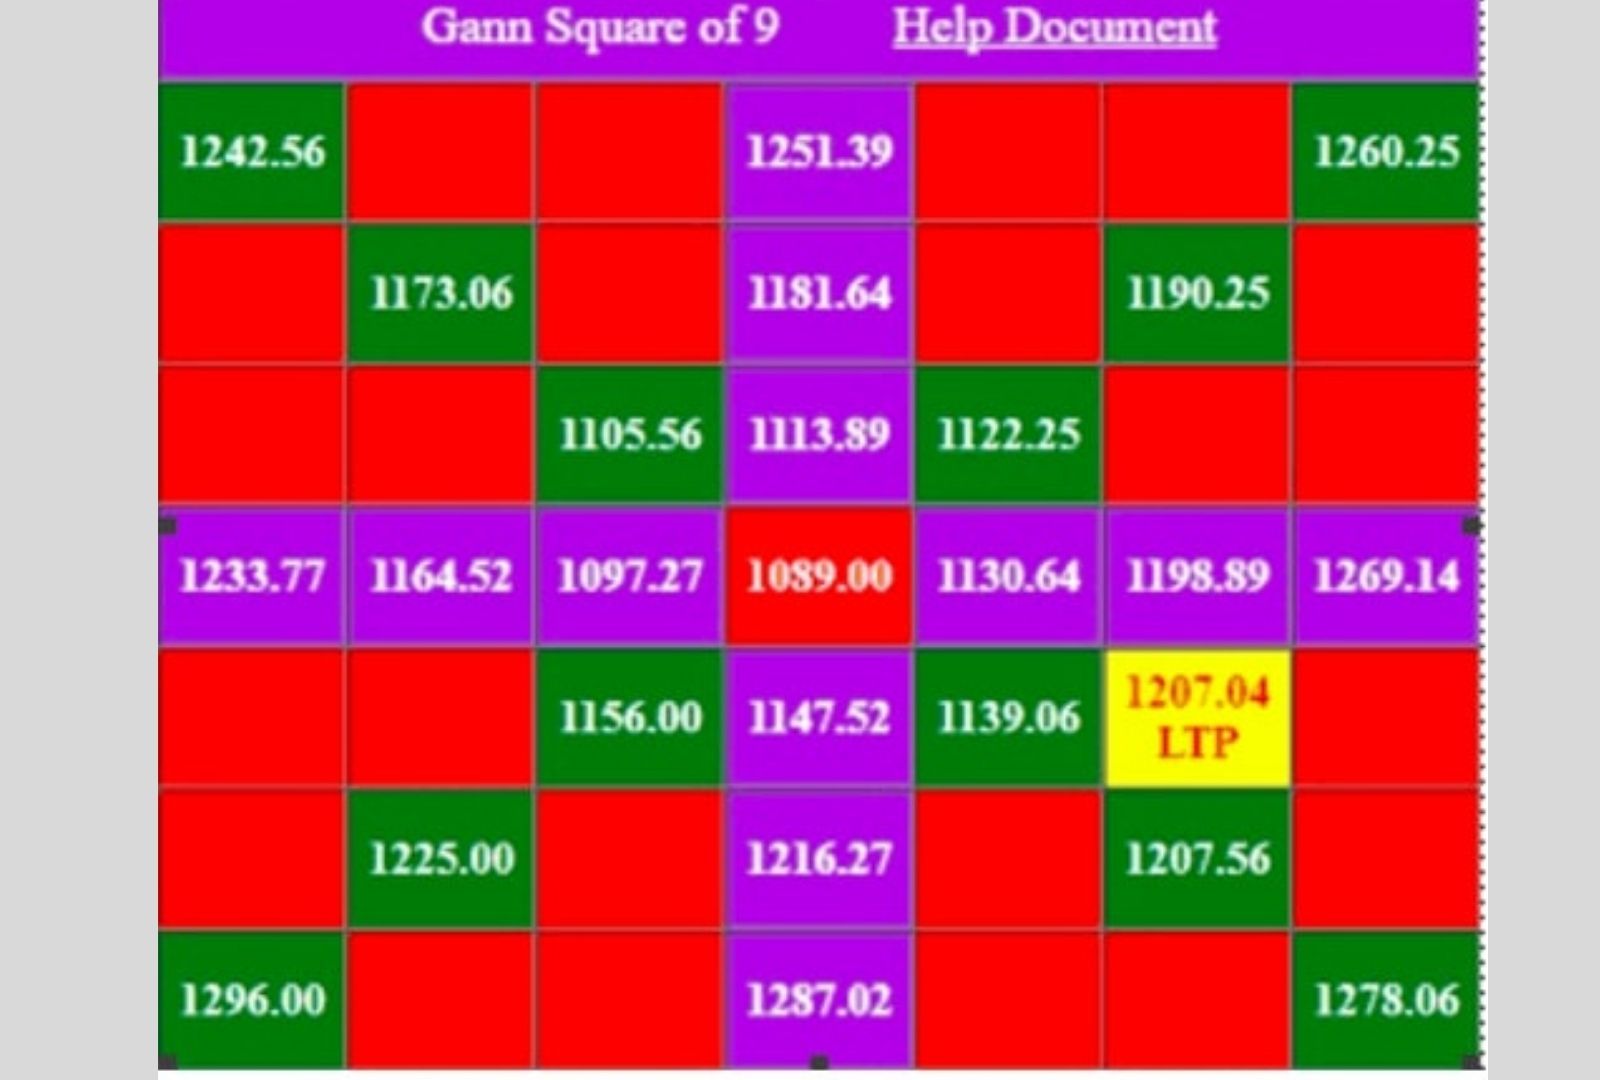
To generate these levels, you need to input the latest trade price in the Gann calculator.
And let’s use the recent Euro Top on 29th August 2017 as an example. The possible numbers are 120.704, 1207.04,12070.4, and 120704. It seems 1207.04 makes the most sense, where each resistance and support is around 100 pips away.
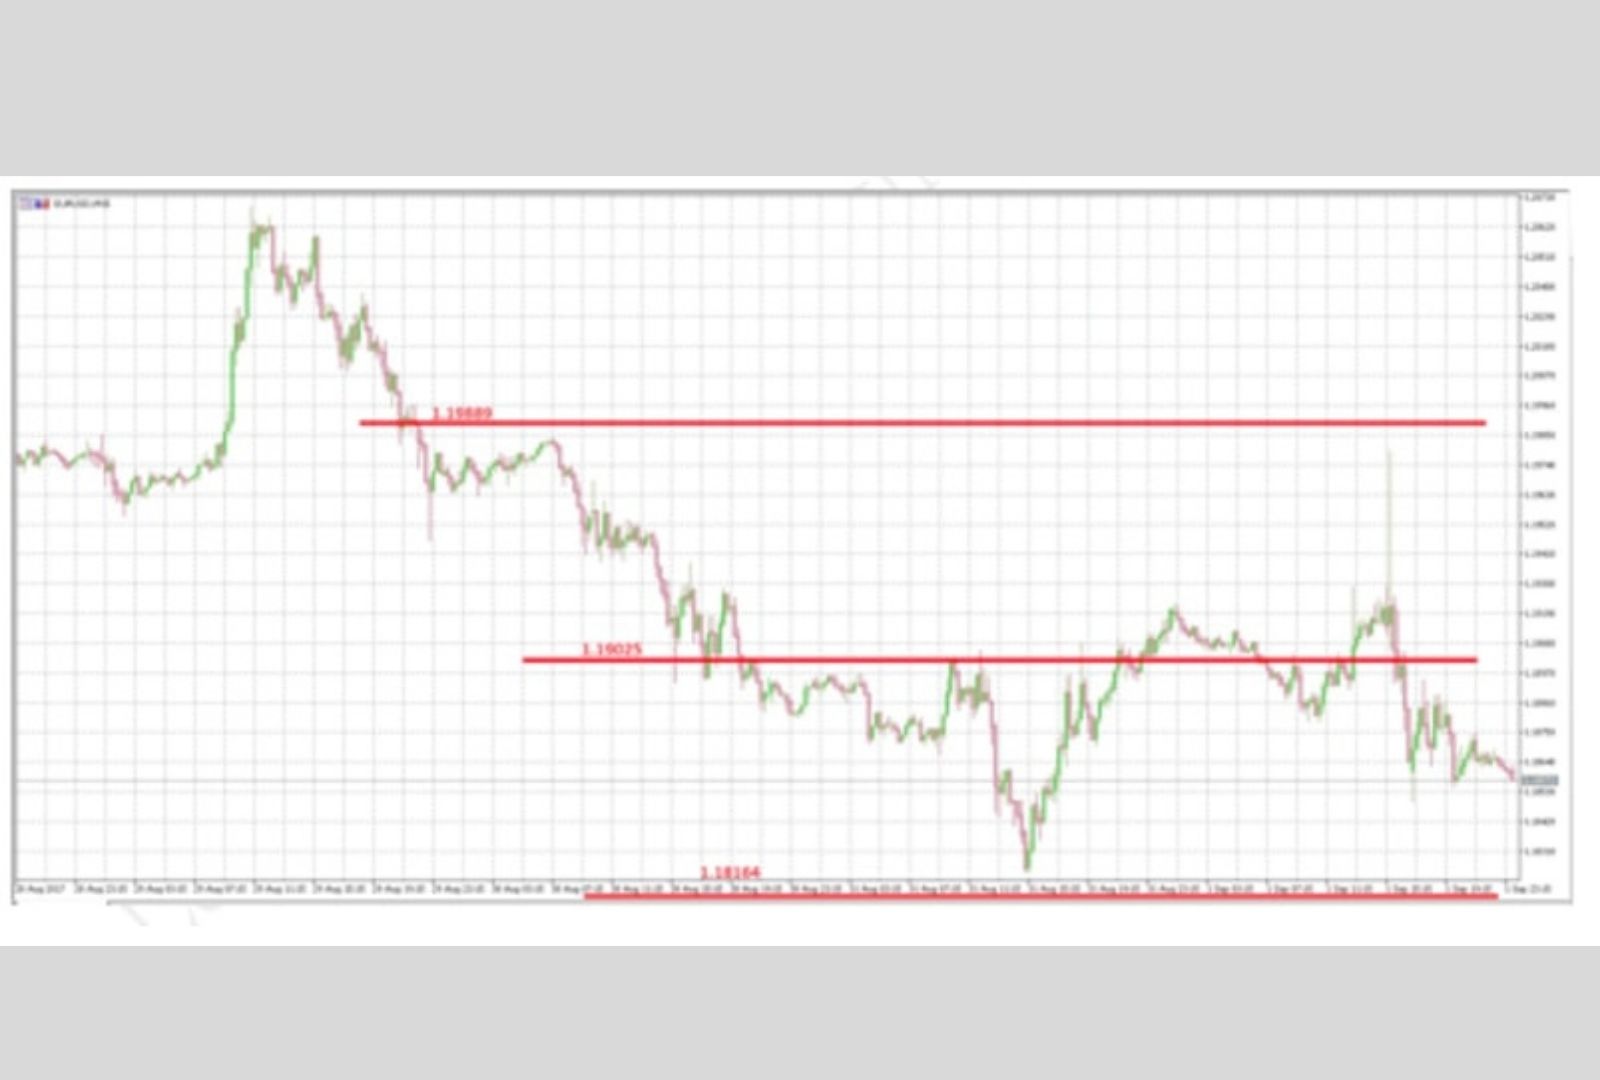
Here’s the Square of Nine’s support and resistance on the EURUSD 15 mins chart from 28th August to 1st September chart:
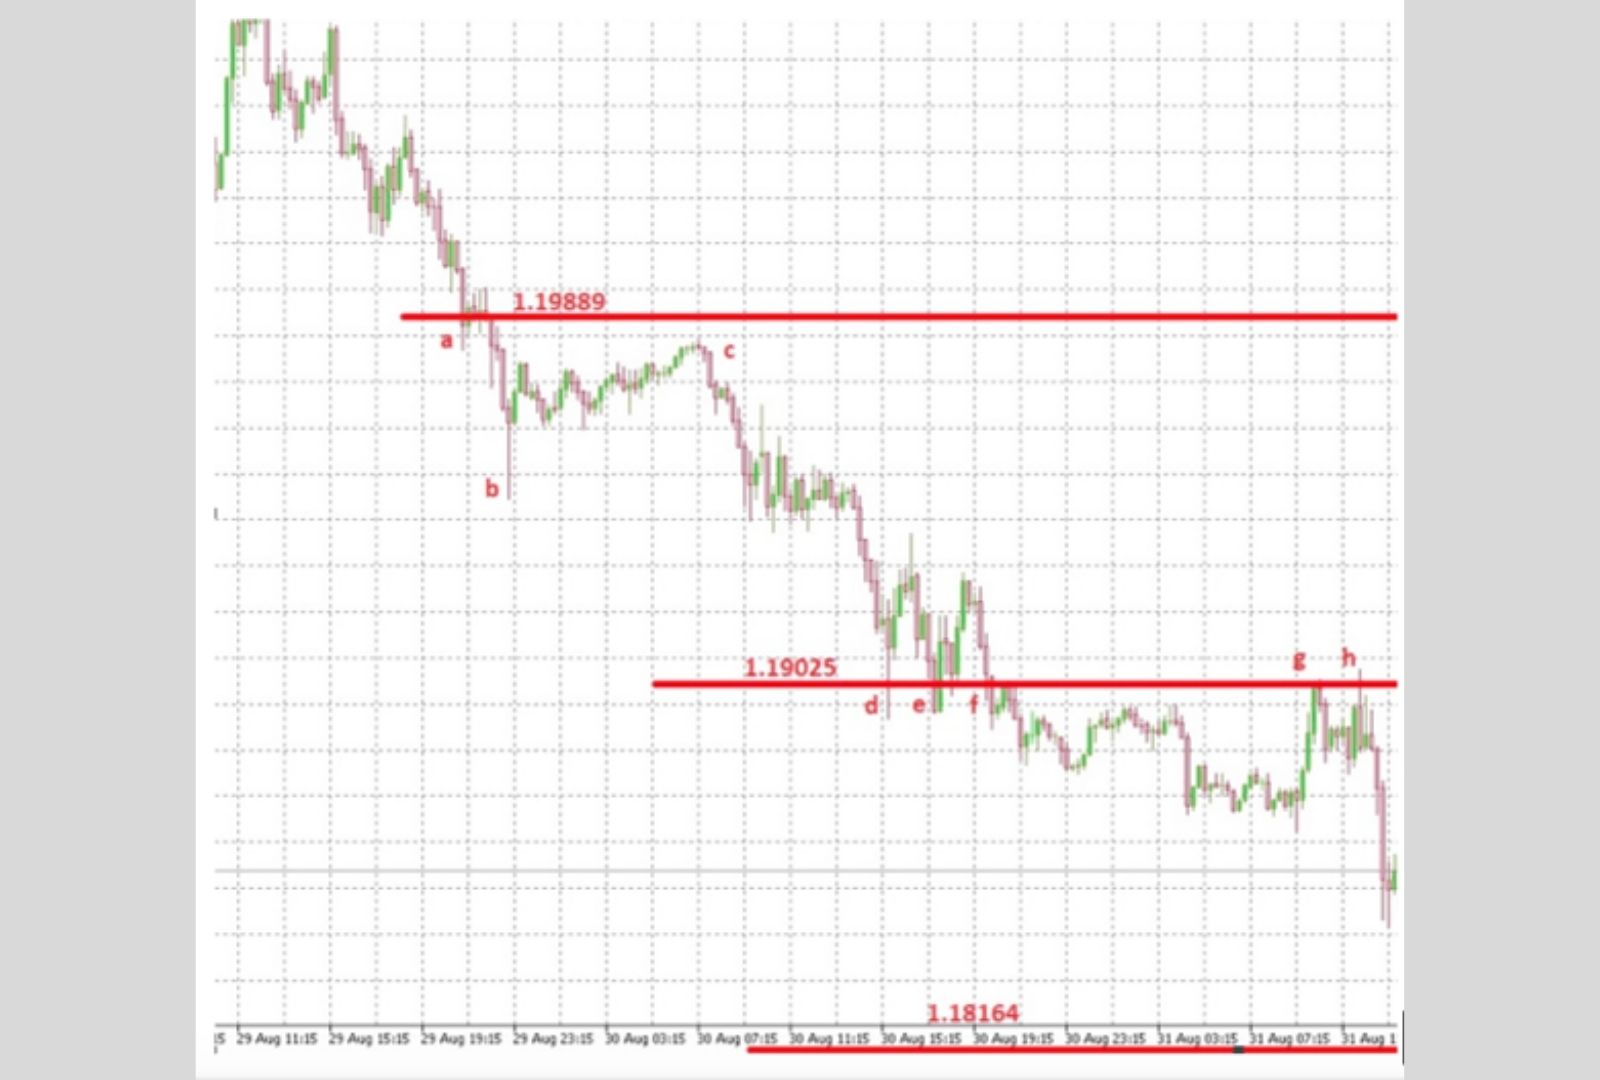
Let’s take a look at the Square of Nine price points marked on the chart below:
Here’s the thing that might have driven you nuts:
a – Support breaks 1.9889; does that mean the market will fall until 1.19025 to receive the next support?
b- No square of 9 support is indicated but yet the market rebounds; what should I do? Should I expect the market to rebound back to the 1.19889 level, or would the market trade all the way down to 1.19025?
c- The market resumed its downward trend again, but it did not touch the square of nine resistance price of 1.19889. Should I be short now? Or would the market return to the support at 1.9889 later?
d- This 1.19029 Square of Nine support works perfectly this time. Should I long the market and expect it to rebound at 1.19889? The “cross” of the square of nine?
e- It formed a double bottom on the Square of Nine support of 1.9029, with a confirmation signal; looks like I can long the market with full confidence!
f – This is the third time it touches 1.9029; WD Gann says the strongest support comes from the market visiting the same price three 3 times to receive
support….but in the next 30 minutes, the market breaks 1.9025 and continues its downtrend
.jpg)
g – This works perfectly with the Square of Nine resistance level again, shall I expect the market to go toward 1.1816, the next “cardinal” value?
h – The Double top on the same value, getting more confidence to sell…and boom! It finally worked!
i – Why is the market starting to rebound without touching the square of nine support of 1.18164? Should I wait a bit longer till the market hits there to close it? Or should I close it now? Maybe the market will go further south, and I am taking less profit than I should!
j – It did break the square of nine 1.19025 resistance; shall I expect the next resistance of 1.19889 to come soon?
k – Why does the market start to go south without touching any square of 9 resistance value?
l,m,n – The triple top on the square of nine resistance value…WD Gann says it is the most confident of all signals…but why does it still fail?
o – The market turns south without touching any square of nine resistance again…should I wait more time and hope 1.9889 to come again?
Still, couldn’t make it work.
Gann’s books and materials are unstructured, and it was designed to take years and decades to crack the code. You might do some research on the internet to see if there are good trainers who can shortcut your way to success and point you in the right direction to putting all the pieces together.
You signed up for the tens of thousands course.
They took you through their thought process, but you couldn’t duplicate what they did.
The price and time don’t come together, and you couldn’t make a trade-off.
Everything in the forecast newsletter was vague and a bit confusing in writing,
Crappy software with not much support,
Most wrong predictions, including key events like the US elections fed rate hike dates, were disappointing considering they charge you so much.
After a few months, you still couldn’t repeat their results.
There are lots of promises but no substance.
It sounds like you’ve bought a program from a salesman, not a trader,
And some trainers are purely astrologers who do not trade,
Product Not As Advertised with No Money Back Guaranteed.
You feel like a loser.
You keep looking for the Holy Grail of trading…you spent years not getting anywhere.
So infuriating!! You might begin wondering, ‘Am I EVER going to figure out the right planetary combination and aspect to get the correct signal to enter and exit the market so I can become a profitable trader?’ Or should I just call it quits?
You are not alone in your frustrations; I’ve been there myself.
I stopped and thought: “There MUST be something that can help me make a consistent profit from trading.”
So, I took a break... and started searching.
I spent $20,000+ on Gann’s materials and 15 years studying and trading with this method, but was still inconsistent. I attended the best of Gann’s seminars and collected most of the original manuscripts such as The Law of Vibration by the late Dr. Jerome Baumring; the original 1927 First Edition Tunnel Thru The Air which is the only version that contains the clue to deciphering how WD Gann used astrology and mathematics to trade; the out of print Bonnie Hill Tunnel Thru The Air one-time seminar in 1992 (Bonnie Hill was one of the members of the Tunnel Lodge Group headed by Petter Ivar Amundsen).
I CRACKED THE CODE. FINALLY!
According to Gann, certain points on the zodiac/ planets relate to the Tops and Bottoms of specific stocks, commodities, or forex markets. Although the sun will aspect a particular point on the zodiac on the same day every year, there is a small tweak to it. With a leap of faith, I then entered into a British Pound trade using his ‘Anniversary Date’ signal on November 9th, 2007 and made a small profit. I previously had the experience of paying a vast sum of money for all the books and courses but could not get it to work.
It’s not a fluke. This ‘unicorn’ signal consistently performs well. A very similar planet set up in the sky on 2007 November 9th, the all-time high of the British Pound, reappeared in the sky again on 2014 September 28, and 2015 November 4. I sold 5 contracts of British pounds each and made a profit of US$30,000+.
I found a way to correct the count of Fibonacci waves, and I suddenly saw the pattern recurring in the market. Wheels within wheels, I see cycles everywhere. History repeats itself, and cycles become prevalent in all financial instruments.
After cracking the secret code, I went from being an inconsistent trader who was burnt out spending countless hours a week to making a consistent trading income.
Why take my word for it?
I then published two books that predicted the 2012-2017 Gold Market turns with just a 1-2 day difference. I then got featured in FXStreet and Stock & Commodities Magazine.
Here’s my time-stamped forecast, published in my Trading Books:
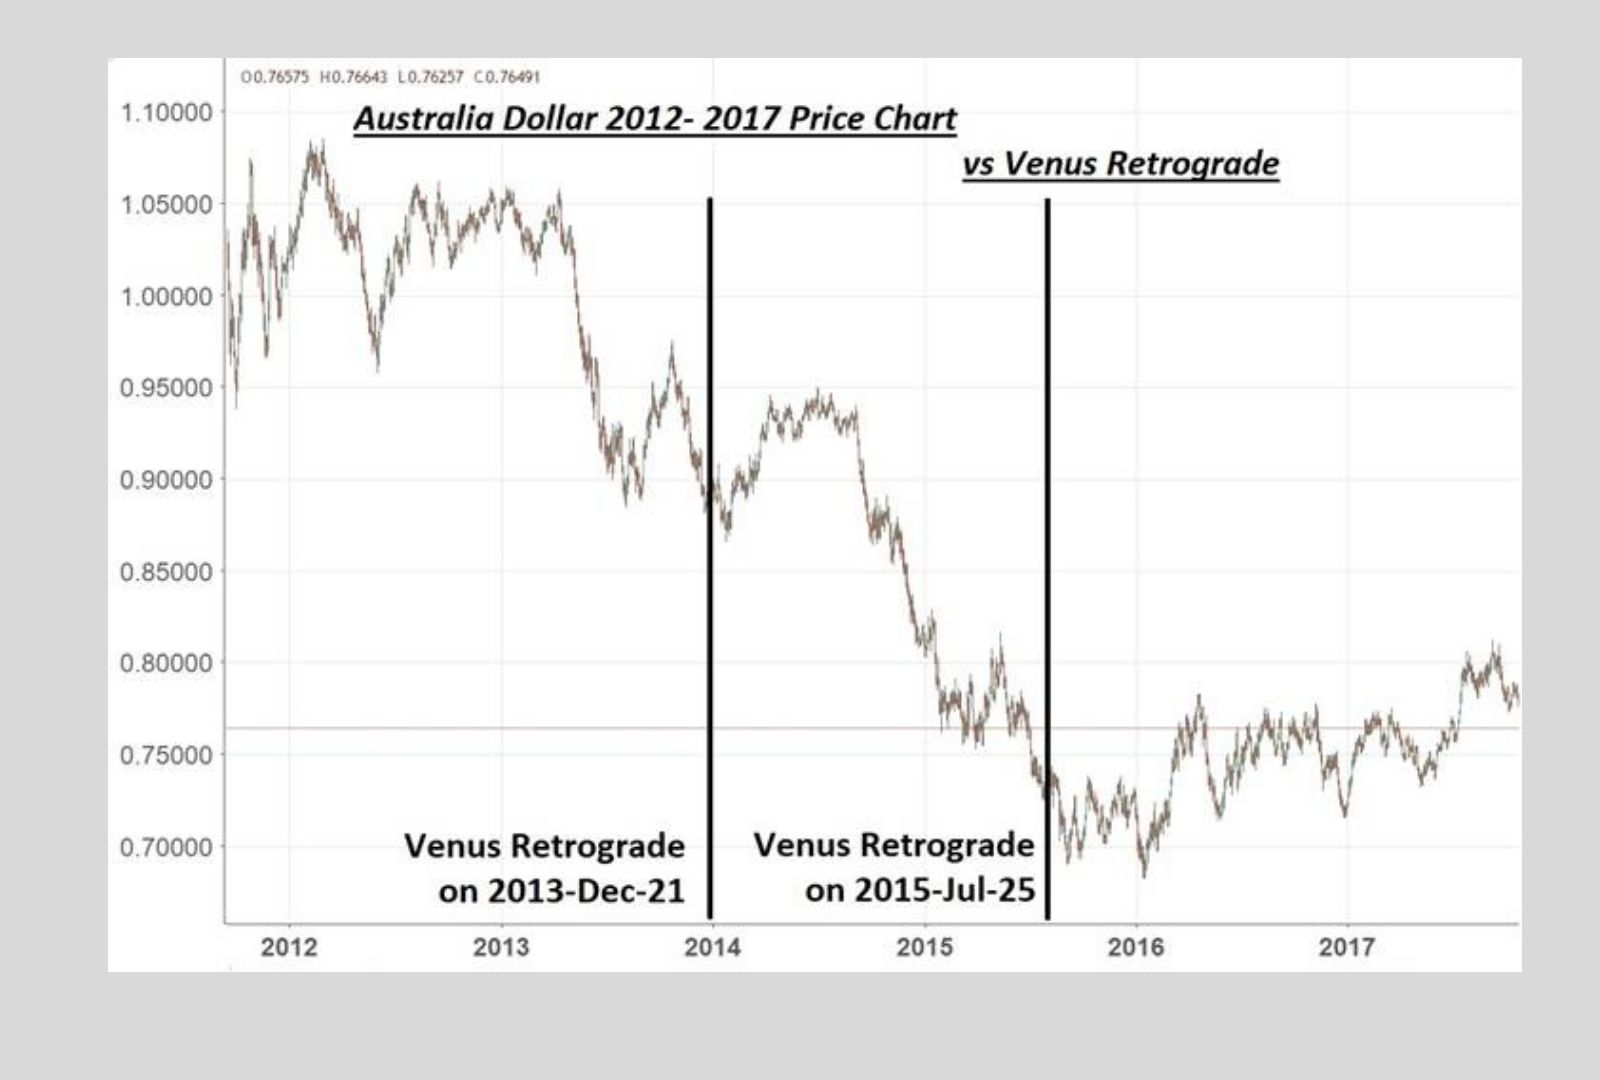
#1 – I predicted the Australian Dollar bottom quickly after Venus Retrograde in 2012 – 2017.
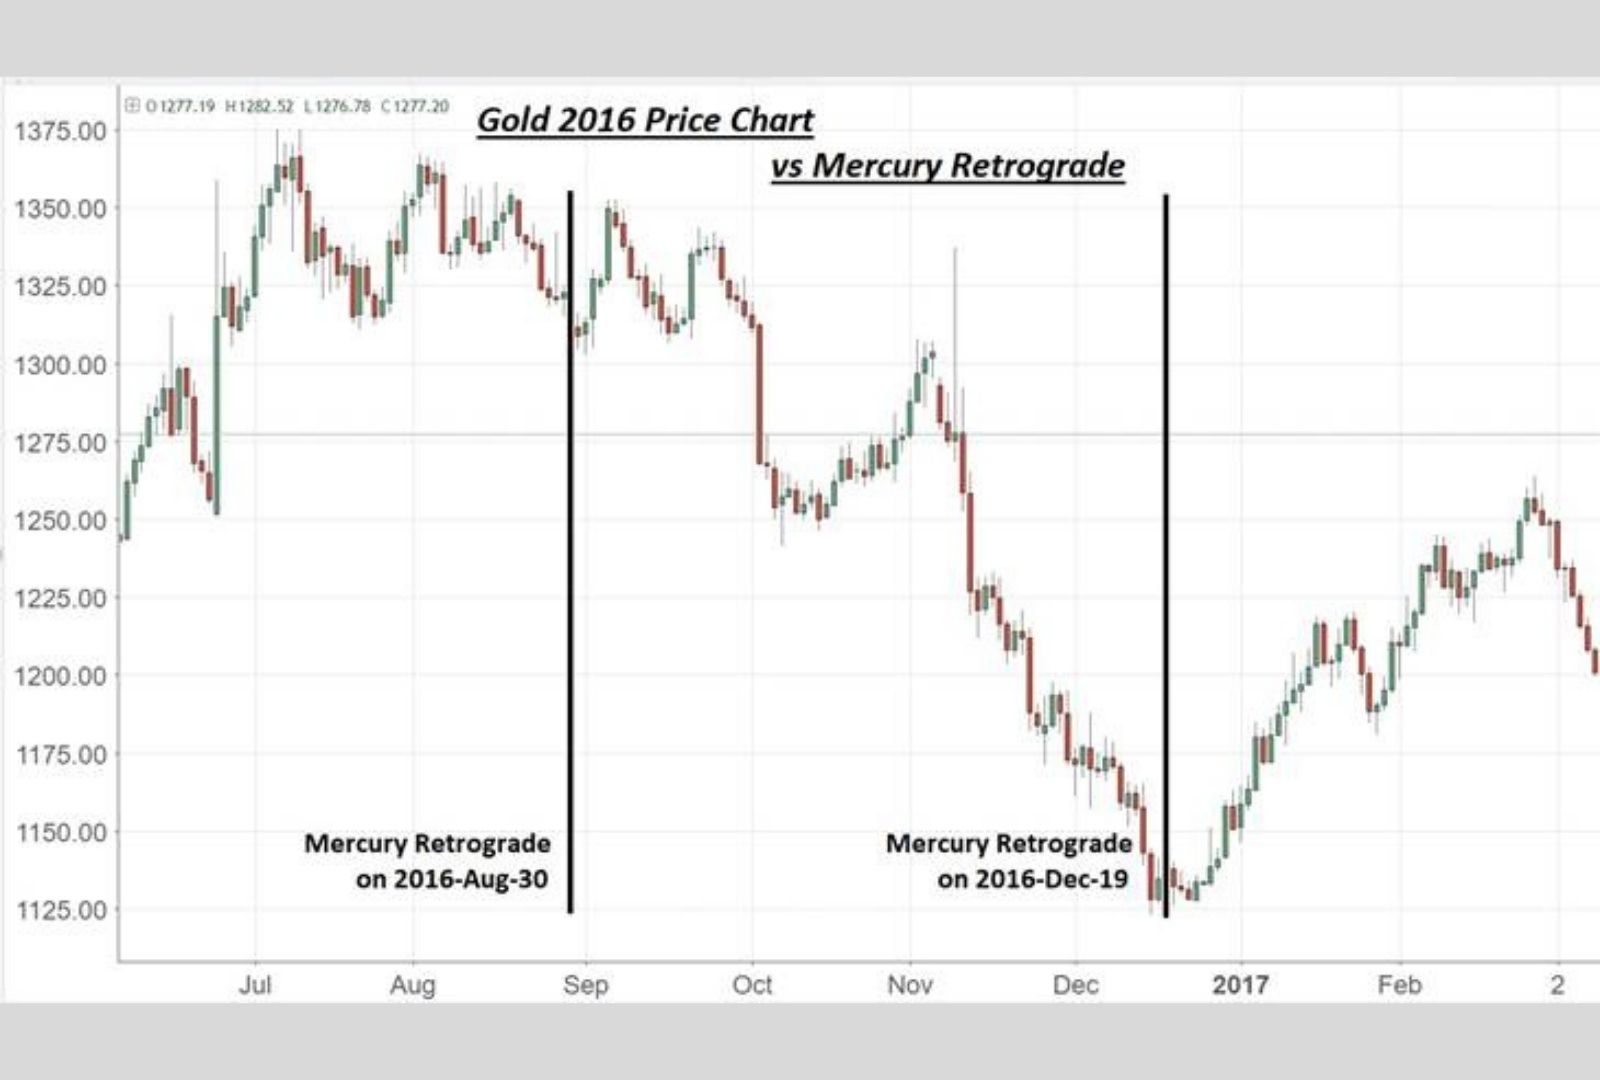
#2 – I predicted the Gold Market reversal with Mercury Retrograde to the exact day in 2016.
#3 Here’s a live example to apply my proprietary Traction Trendline on a post-Non-Farm Payrolls EUR.USD Trade on November 3, 2017, on a LIVE WEBINAR.
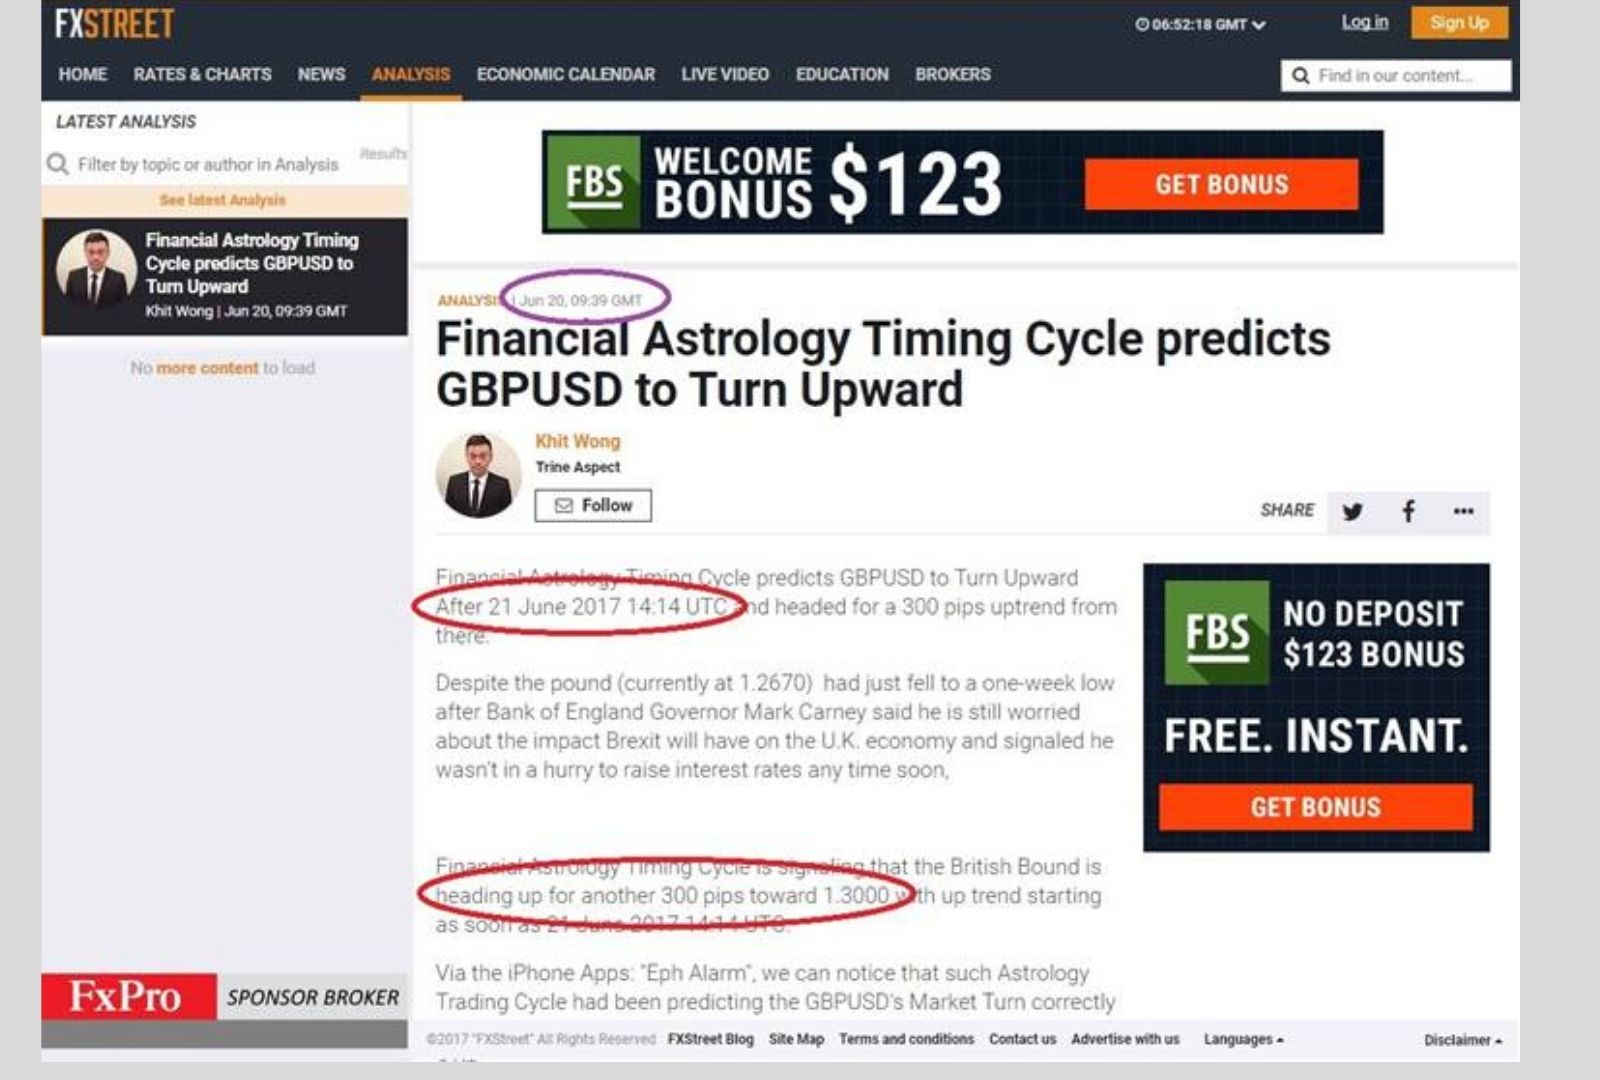
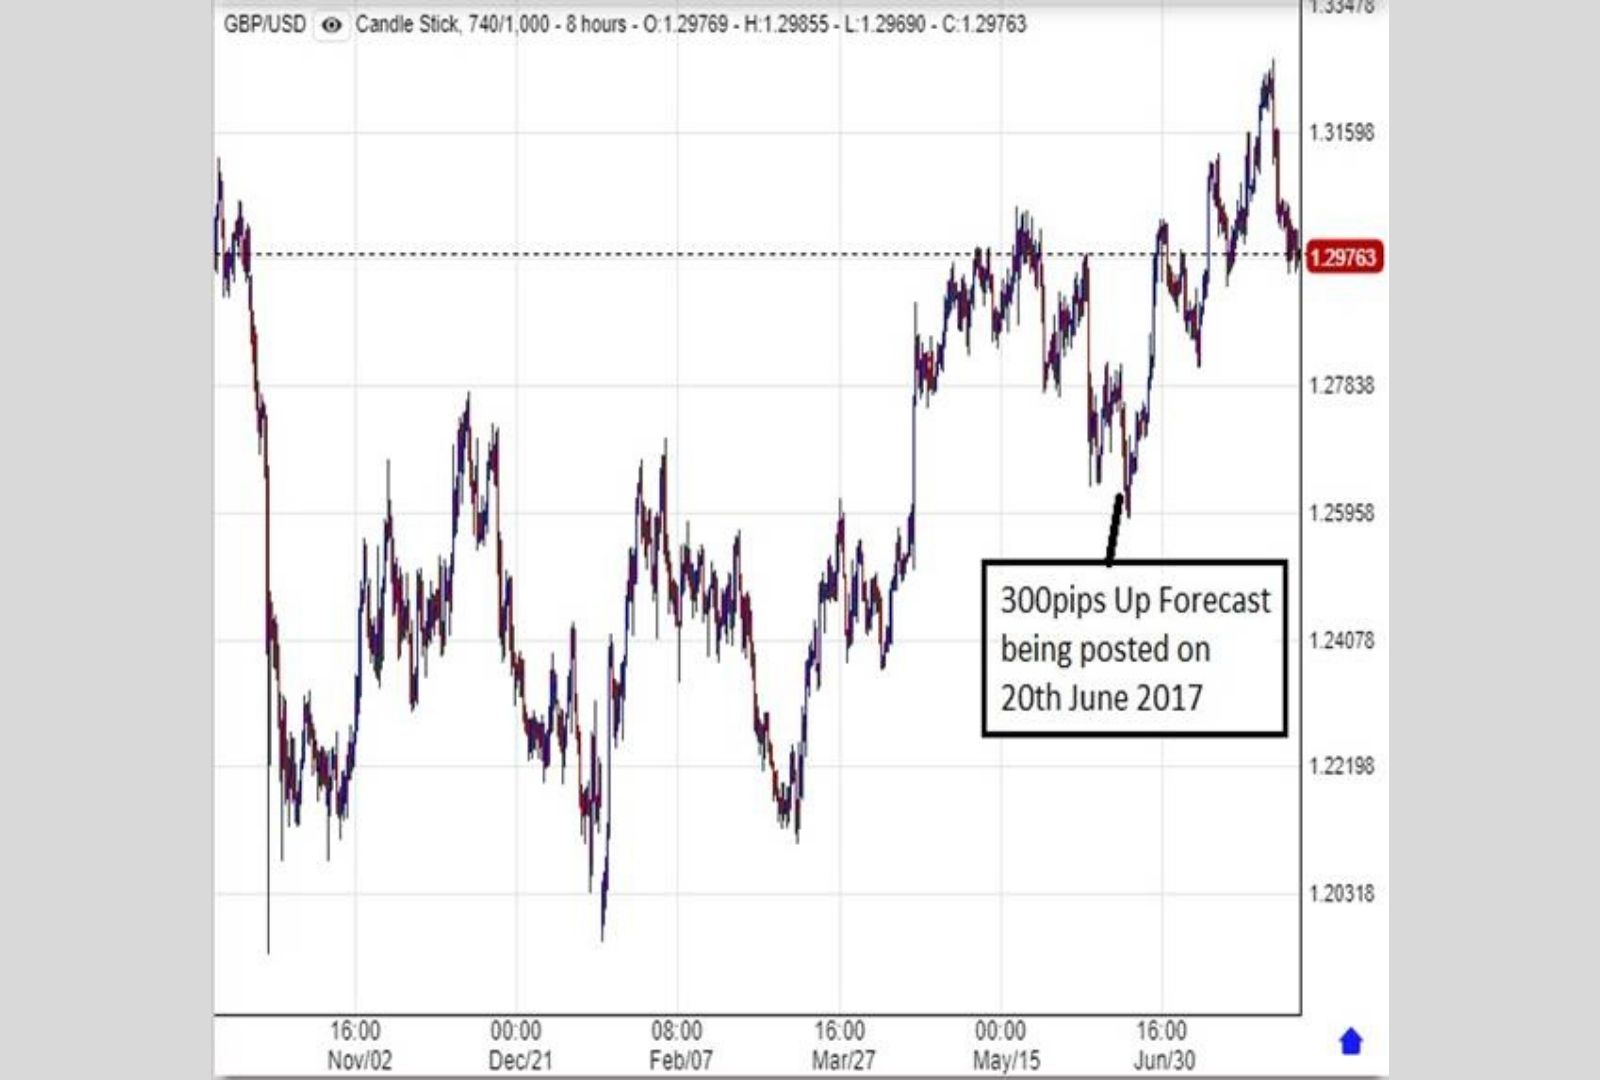
#4 The Astro & Mathematical Methods Combined (a Time-Stamped Example included)I combined the astrological and mathematical timing techniques to identify a market setup. I predicted a 300-pip move on a timestamped FXStreet forecast on June 20, 2017.
Are you a WD Gann trader who needs or wants to fast-track your progress and monetize your skills?
Do you constantly struggle with having to figure out how to decode Gann’s work?
Now, you have an opportunity to get into W.D. Gann's head and debunk the Astro trading myth with me. Click here to sign up for the Astro Reset Masterclass for just $1
If you're an avid Gann Trader, check out the free video training here: https://training.gannexplained.com/